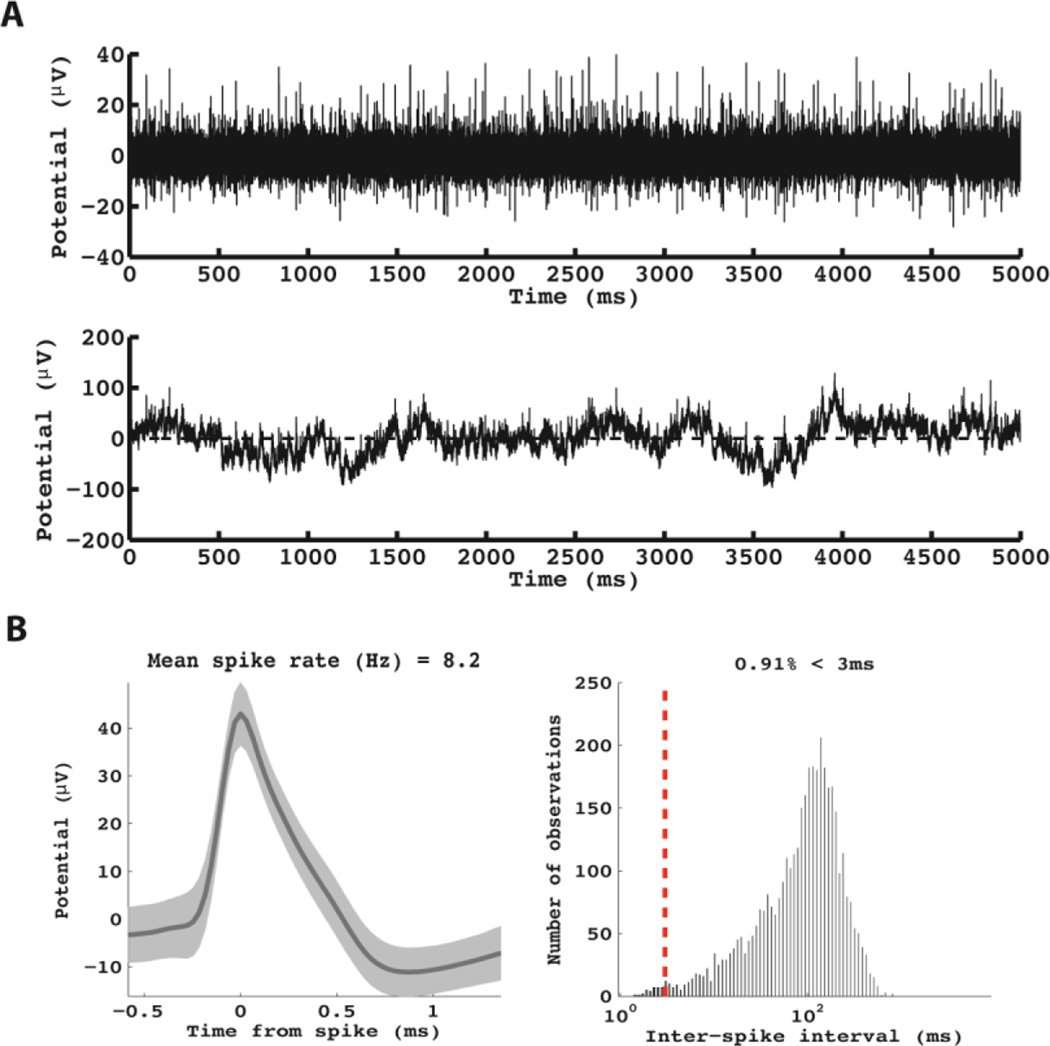
Figure 5.
Example of neuronal data obtained from the patient in Figures 2 and 4. This unit was recorded from the most anterior electrode. A: The raw (bottom panel) and pass-band filtered (300–9000 Hz, top-panel) raw voltage traces are shown for this micro-wire. B: The average waveform (left panel) and the distribution of inter-spike intervals (right panel) are shown.

