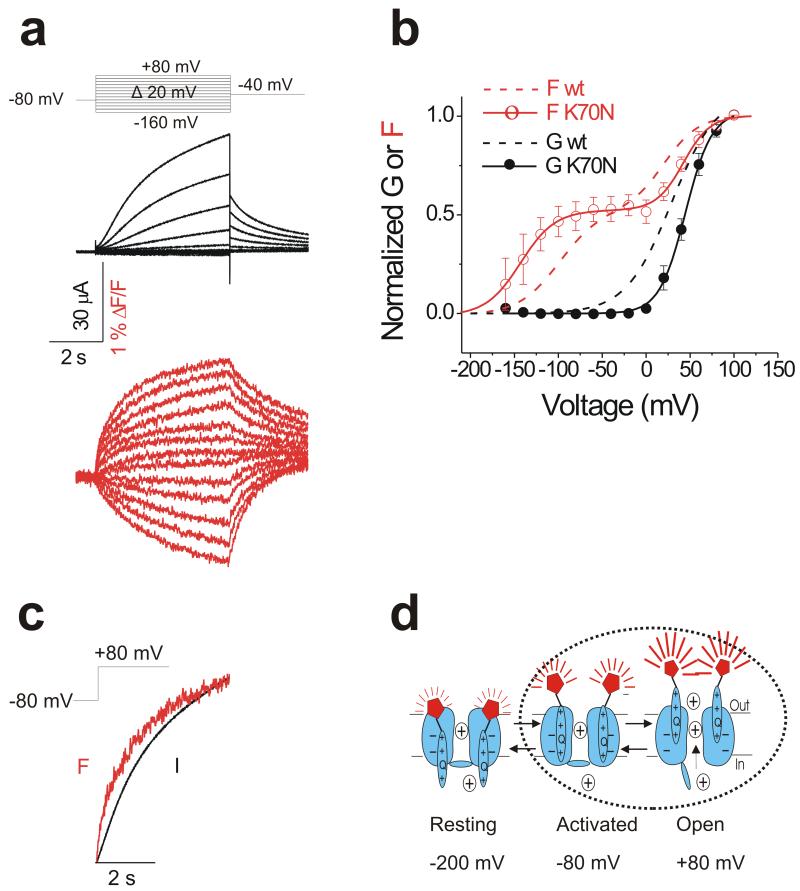
Figure 5. K70N in KNCE1 farther separates the two voltage sensor movements of KCNQ1.
(a) Representative current (black) and fluorescence (red) traces from KCNQ1 channel coexpressed with KCNE1 K70N mutant in response to the indicated protocol (top).
(b) Normalized G(V) (filled black circle and black line from a Boltzmann fit) and F(V) (open red circle and red line from a double Boltzmann fit) of recordings from KCNQ1/KCNE1 K70N channels. Data are mean ± SEM; n= 7. Dashed lines represent wild type KCNQ1/KCNE1 G(V) (black) and F(V) (red) curves for comparison. K70N G1/2 = 44.8 ± 0.9, K70N F11/2 = −143.0 ± 13.0 mV, K70N F21/2 = 42.3 ± 2.6 mV; See Fig. 1c for wt F11/2 and F21/2.
(c) Time course of current (black) and fluorescence (red) in response to + 80 mV pulse for 5 s.
(d) Cartoon of KCNQ1/KCNE1 K70N gating. At −80 mV, K70N channels are mainly in the activated closed state, so a depolarization from −80 mV will only show mainly the slow fluorescence component that correlates with channel opening.

