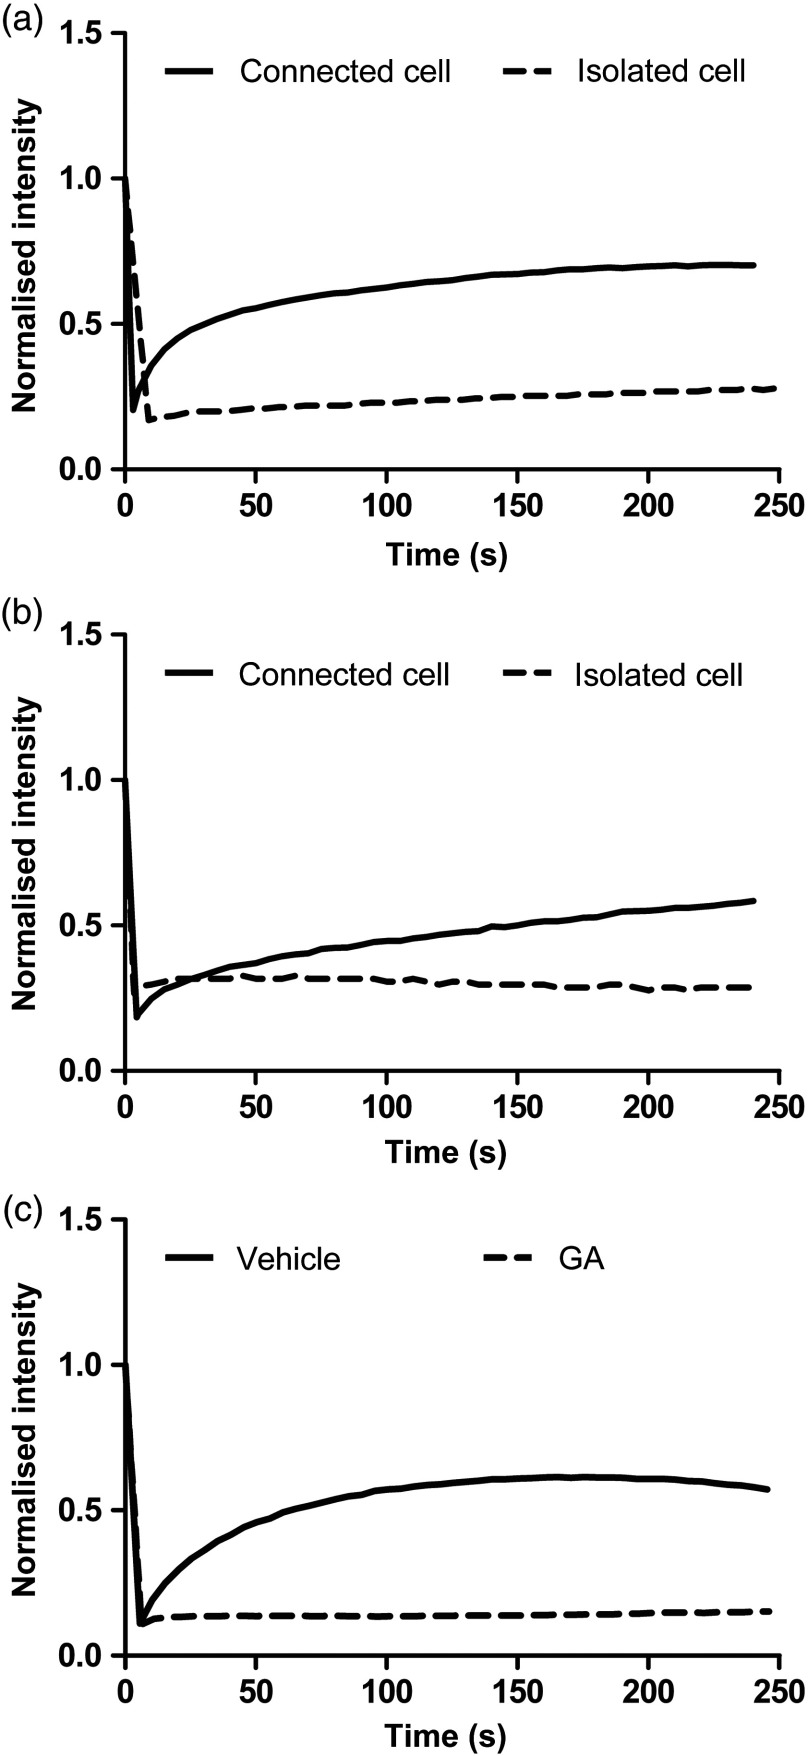
Fig. 5.
Representative fluorescence recovery after photobleaching (FRAP) curves showing the changes in fluorescence intensities over time in cells from the same donor, subjected to photobleaching, and cultured in different conditions. (a) Connected versus isolated cells in 2-D culture. (b) Connected versus isolated cells in 3-D culture. (c) Gap junction blocking with GA.

