
Fig. 1.
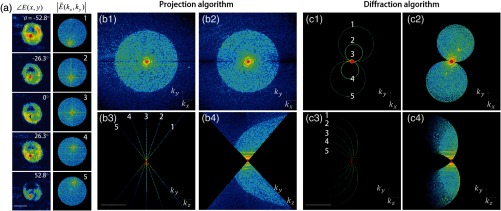
Comparison of various three-dimensional (3-D) reconstruction algorithms. (a) Quantitative phase images of a Plasmodium falciparum-red blood cells (Pf-RBC) in trophozoite stage measured at various illumination angles (left) and corresponding spectrum in Fourier space (right). (b–c) Object functions in Fourier space reconstructed by (b) the projection algorithm and (c) the diffraction algorithm. (b1) Amplitude distributions of the object function reconstructed by the projection algorithm in the plane with five representative illuminations angles and (b2) with the full illumination angles. The corresponding amplitude distributions in the plane are shown in (b3) and (b4), respectively. (c1) Amplitude distributions of the object function reconstructed by the diffraction algorithm in the plane with five representative illuminations angles and (c2) with the full illumination angles. The corresponding amplitude distributions in the plane are shown in (c3) and (c4), respectively.