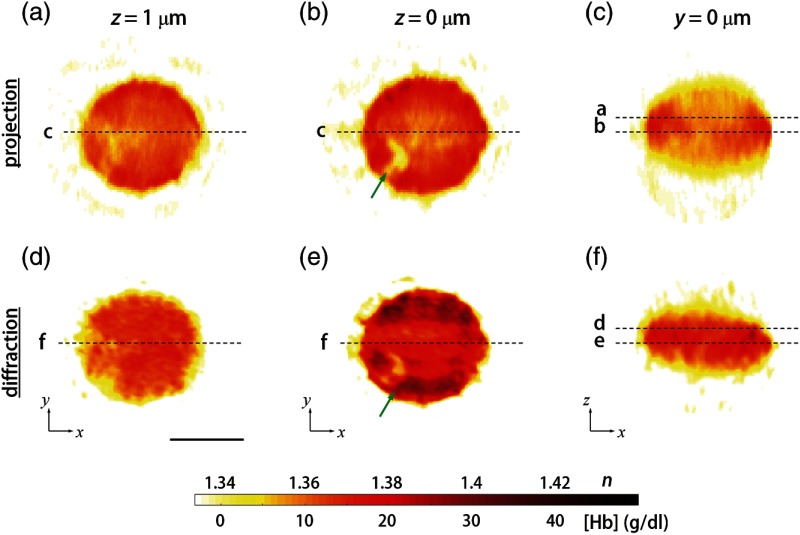
Fig. 2.
Refractive index (RI) maps of a Pf-RBC at the ring stage. (a–c) cross-sectional slices of RI distribution mapped with the projection algorithm at (a) 1 μm above the focal plane, (b) the focal plane, and (c) the plane at the center. (d–f) Slices of RI distribution mapped with the diffraction algorithm. Green arrow indicates malaria parasite. Each dashed line stands for corresponding slices. Scale bar indicates 5 μm.

