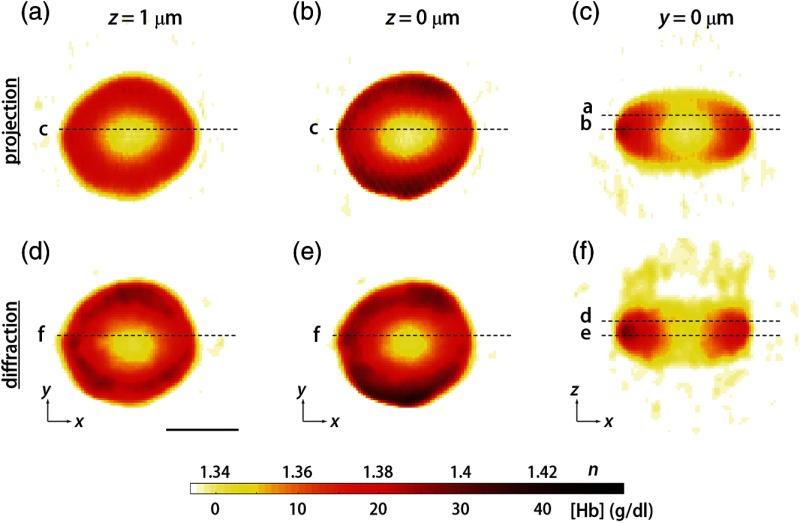
Fig. 5.
RI maps of a healthy RBC. (a–c) cross-sectional slices of RI distribution mapped with the projection algorithm at (a) 1 μm above the focal plane, (b) the focal plane, and (c) the plane at the center. (d–f) Slices of RI distribution mapped with the diffraction algorithm. Scale bar indicates 5 μm.

