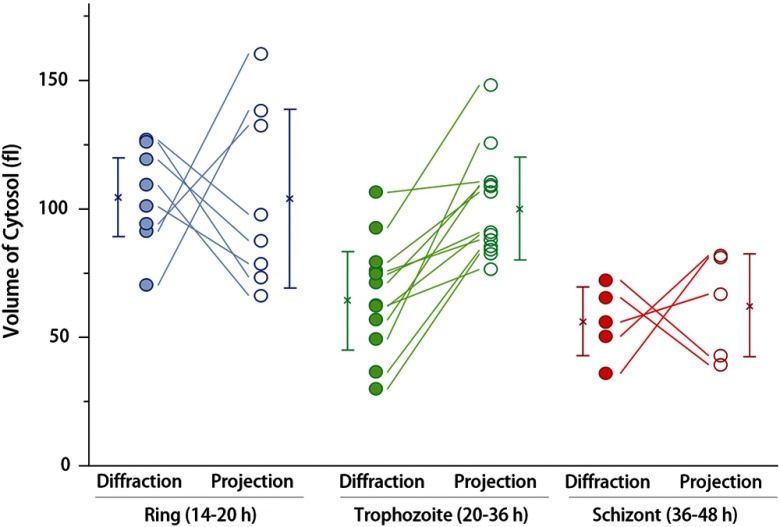
Fig. 7.
Cytoplasmic volumes calculated by different reconstruction algorithms. Circular symbols represent individual Pf-RBCs. Dashed lines connect the values of the same cell calculated with the different algorithms. The cross symbols represent the median values, and the vertical lines indicate standard deviations.

