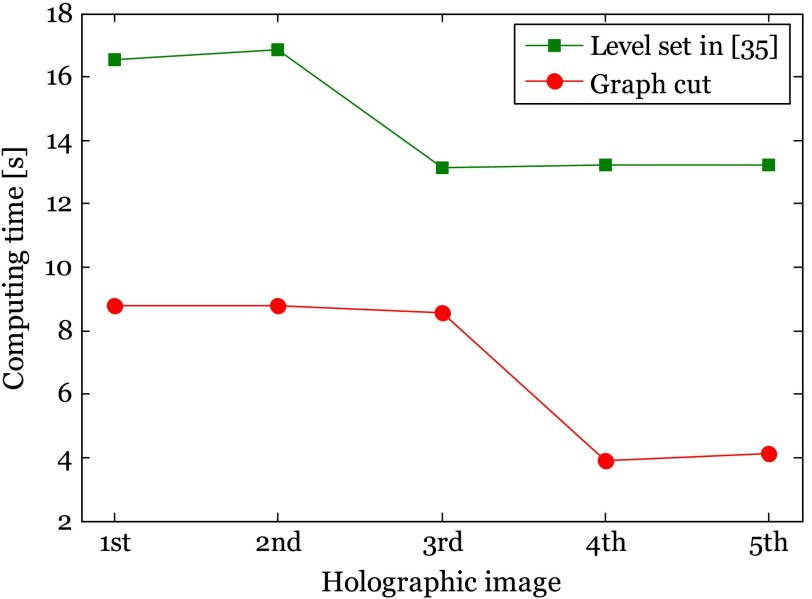
Fig. 10.
Computing time between level-set method in Ref. 35 and automatic graph-cut part in interactive graph-cut method. The first image is sunflower stem cell with a size of , the second image is Diatom alga with a single target and a size of , the third image is Diatom alga with multiple targets and an image size of , the fourth image is RBCs with predominantly stomatocyte shape and an image size of , and the fifth image is RBCs with predominantly discocyte shape and an image size of , as in the order showed in Fig. 8. In this figure, the computing times are measured with the parameters including , , and iteration times selected from Fig. 9, where the best segmentation accuracy is achieved.

