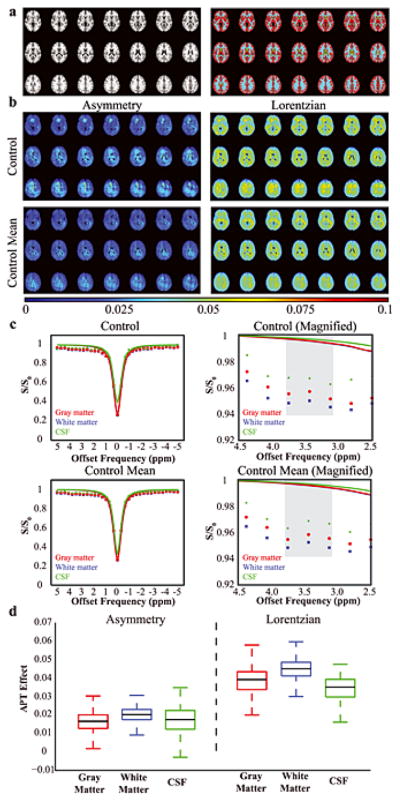
Figure 2. Control volunteer results (n = 5).

(a) To allow for comparison between different tissue types, control data were co-registered to a standard T1-weighted atlas and gray matter (red), white matter (blue) and CSF (green) masks derived from the Harvard-Oxford Cortical Atlas were applied. (b) APT data from a representative control volunteer and from all control volunteers (mean), separately for the asymmetry and Lorentzian analysis approaches. (c) Z-spectra for the representative control volunteer and the mean of all control volunteers. On right, a magnification is show to highlight the small differences in the APT effect at 3.8–3.2 ppm (gray). The colored lines denote the Lorentzian fit to the full z-spectrum. Importantly, note that the Lorentzian fit is predominately sensitive to the data points near the water resonance where the residuals have the potential to be highest and is essentially unity near the amide resonance. (d) A boxplot showing the APT values in the different tissue types. The black line denotes the median, the upper and lower lines denote the upper 75th percentile of the data and lower 25th percentile of the data, and the whiskers extend to the remaining data points.
