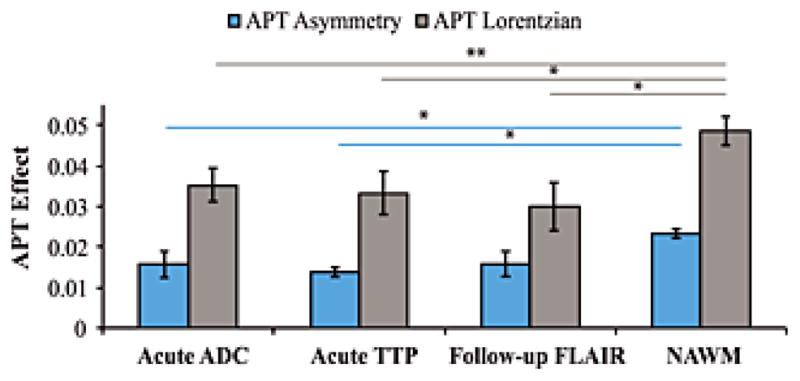
Figure 7. Group results.

Bar graph showing the amide proton transfer (APT) effect (separately for the asymmetry and Lorentzian approaches) for all patients in different segmented regions-of-interst. The two patients with negative asymmetry (Fig. 6) were excluded in the asymmetry analysis. In both analyses, normal appearing white matter (NAWM) gave larger APT effects than different ischemic regions (P=0.03), however no significant finding was observed between the size of the APT effect within the different ischemic regions. Error bars denote standard error. * P<0.05. **P≤0.01.
