. 2014 May 2;8:425. doi: 10.3332/ecancer.2014.425

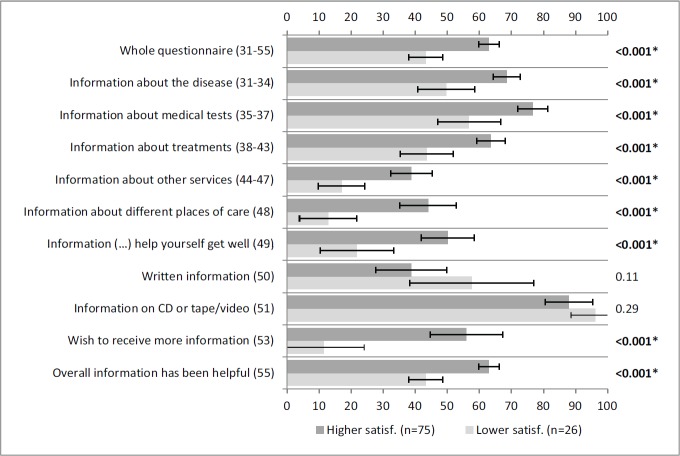
Figure 3: Self-reported information according to satisfaction with information. A lower satisfaction (lowest through mean) and higher satisfaction (mean through highest) correspond to answers to item 52 (‘satisfaction with the amount of information received‘) of INFO25. Vertical axis: INFO25 questions; horizontal axis: scores on the INFO25 questions (items range from 0 to 100). Higher scores mean a higher level of information received, higher information wishes, and higher satisfaction. Error bars represent 95% confidence intervals. P-values (Mann–Whitney U tests) appear on the right, with significant p-values shown in bold and comparisons that remain statistically significant after Bonferroni correction signalled with an asterisk.

Figure 3: