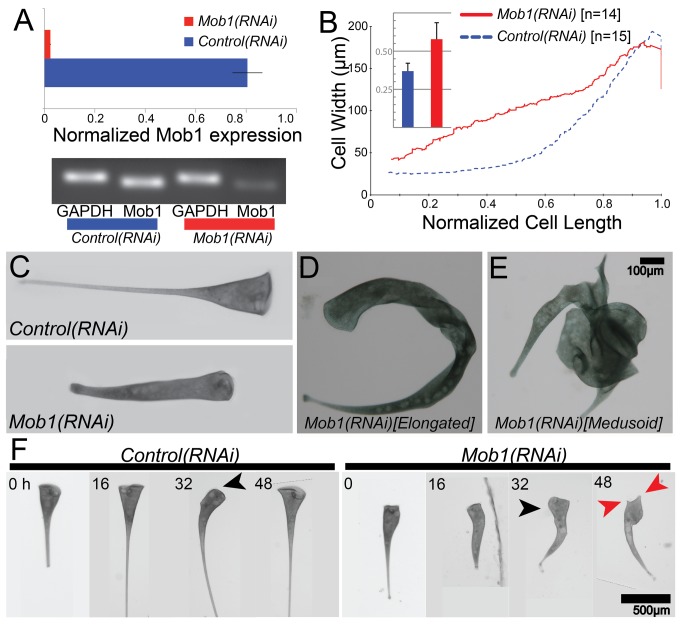
Figure 5. Mob1(RNAi) cells lose proper cell proportions and body axes.
(A) qRT-PCR data showing relative expression of Mob1 normalized to GAPDH expression in control and Mob1(RNAi) cells. (B) Quantitative analysis of the proportionality defect plotted as a graph of cell width versus normalized cell length for control(RNAi) (blue, n = 14) and Mob1(RNAi) (red, n = 15) cells. Data for each line represent a moving average of all samples with a window size of 2n. These measurements were used to compute a shape factor as described in Materials and Methods and graphed in the inset bar graph. The shape factor describes deviation from a shape having perfect straight lines on the cell edge. Data in the inset show an increase in shape factor from 0.37±0.052 (n = 15) in control cells to 0.58±0.108 (n = 14) in Mob1(RNAi) cells, a highly significant increase (p = 1.8×10⁻⁶). (C) Control cell's canonical shape as compared to a Mob1(RNAi) cell fed the RNAi vector for 3 d, showing altered cell proportionality. (D, E) Brightfield image of an elongated (D) and medusoid (E) cell. (F) Selected images from a time course. Control(RNAi) and Mob1(RNAi) cells were isolated after 2 d of feeding and imaged every 2 h for an additional 52 h. Spontaneous reorganization of the OA (black arrows) occurred prior to the multipolar phenotype (red arrows) in Mob1(RNAi) cells.

