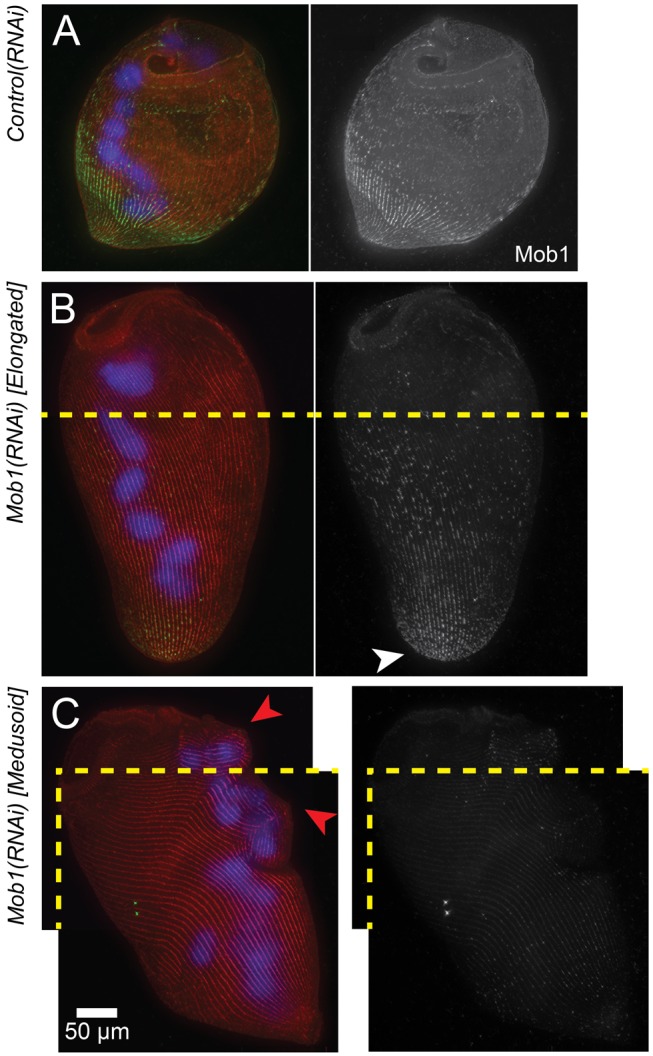
Figure 6. Presence of residual Mob1 protein in Mob1(RNAi) cells.

(A) Immunofluorescence images of stained control(RNAi) cells showing Mob1 localization (green, anti-Mob1), macronucleus (blue, DAPI), and cortical rows (red, stentorin-autofluorescence). (B, C) Immunofluorescence images of stained elongated (B) and medusoid (C) Mob1(RNAi) cells; Mob1 (green, anti-Mob1), macronucleus (blue, DAPI), and cortical rows (red, stentorin autofluorescence) (compare to A). Cortical aberrations are seen in the cortical rows (red arrows). Both the elongated and medusoid cells were too large to fit in a single frame, and two separate images were taken with identical settings, then manually stitched together using the cortical rows for alignment (join-lines between images are indicated by a dashed yellow line).
