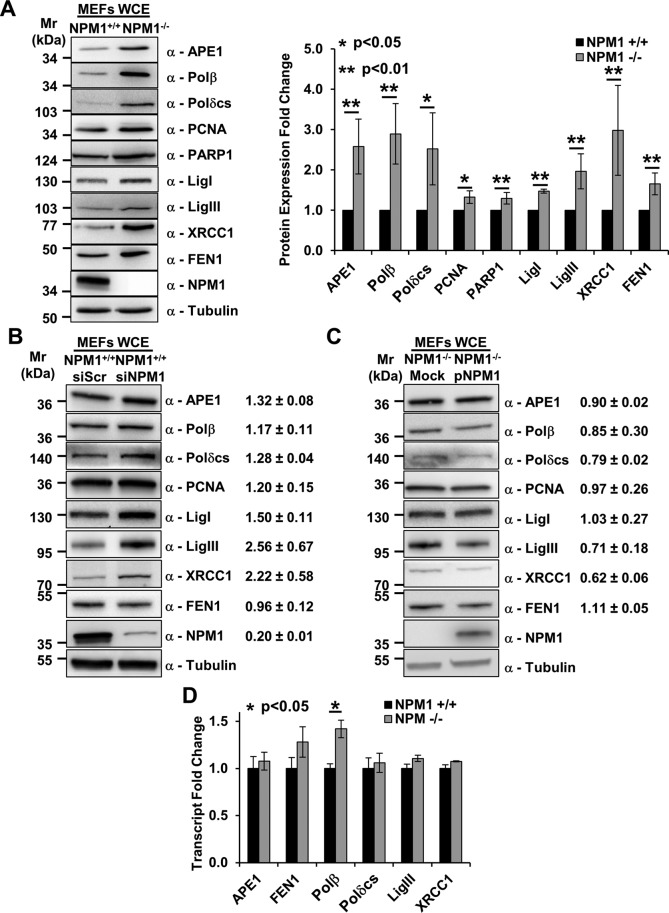
FIGURE 1:
Depletion of NPM1 positively modulates BER protein amounts. (A) Representative Western blotting analysis on NPM1+/+ and NPM1−/− whole-cell extracts (60 μg), showing the higher levels of BER proteins in the absence of NPM1 expression (left). Antibodies used are indicated on the right-hand side. Right, histogram reporting densitometric quantification of Western blotting signals from at least three independent experiments. Protein amounts are expressed as mean ± SD of the signal, considering NPM1+/+ as reference sample. Either actin or tubulin was used as loading control. (B, C). Representative Western blotting analysis on whole-cell extracts (50 μg) from scrambled siRNA (siScr), NPM1 siRNA (siNPM1)-treated NPM1+/+ cells (B), and mock- or NPM1-reconstituted (pNPM1) NPM1−/− cells (C). Change in BER protein levels upon NPM1 down-regulation or reexpression are indicated on the right-hand side. siScr cells or mock-transfected cells were used as reference, respectively. Values indicated are mean ± SD from at least three independent replicates. Antibodies used are indicated on the right-hand side; tubulin was used as loading control. (D) Real-time PCR analysis comparing the relative amount of transcript for the indicated BER factors between NPM1+/+ and NPM1−/− cells. Among the genes tested, only Polβ showed a statistically significant increment. Values reported are expressed as mean ± SD of the expression level in three independent replicates, considering NPM1+/+ as reference sample.

