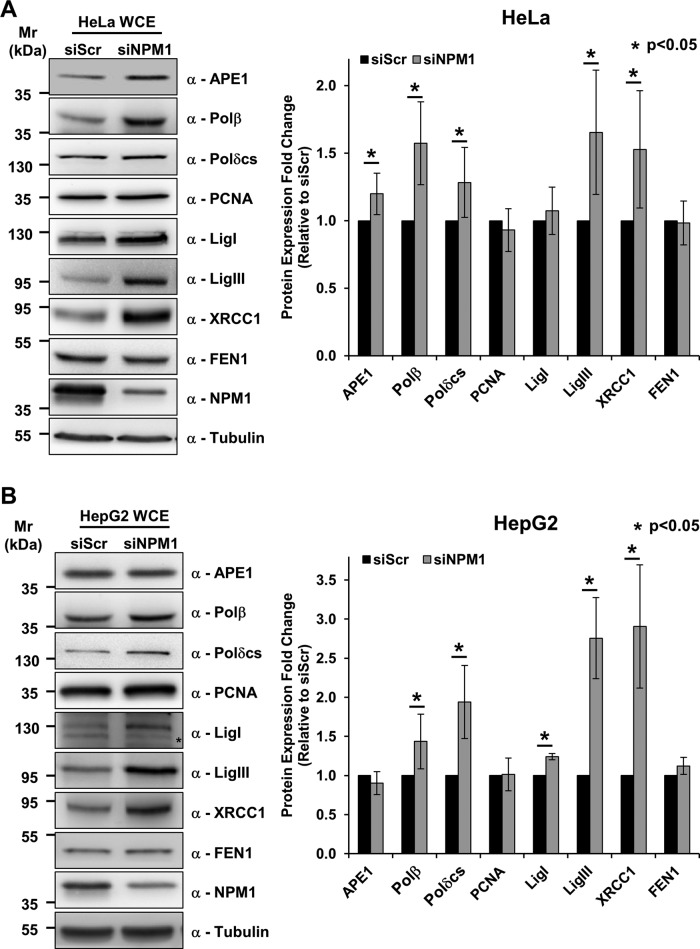
FIGURE 2:
NPM1 knockdown positively modulates BER proteins independently of p53 status. (A) Representative Western blotting analysis on HeLa whole-cell extracts (50 μg) from scrambled siRNA (siScr)– or NPM1 siRNA (siNPM1)–treated cells (left). An increased amount of a subset of BER proteins is visible upon NPM1 down-regulation. Antibodies used are indicated on the right-hand side. Right, histogram reporting the quantitative increment of different BER proteins in HeLa cells upon NPM1 down-regulation. Values reported are expressed as mean ± SD of the fold of induction relative to siScr-treated cells in at least three independent replicates. (B) Representative Western blotting analysis on HepG2 whole-cell extracts (50 μg) obtained from siScr or siNPM1 cells (left). NPM1 depletion leads to accumulation of different BER proteins. Antibodies used are indicated on the right-hand side. *Unspecific band. Right, histogram reporting the increase of BER protein levels in HepG2 cells upon NPM1 down-regulation. Values reported are expressed as mean ± SD of the fold of induction relative to siScr-treated cells in at least three independent replicates.

