FIGURE 2:
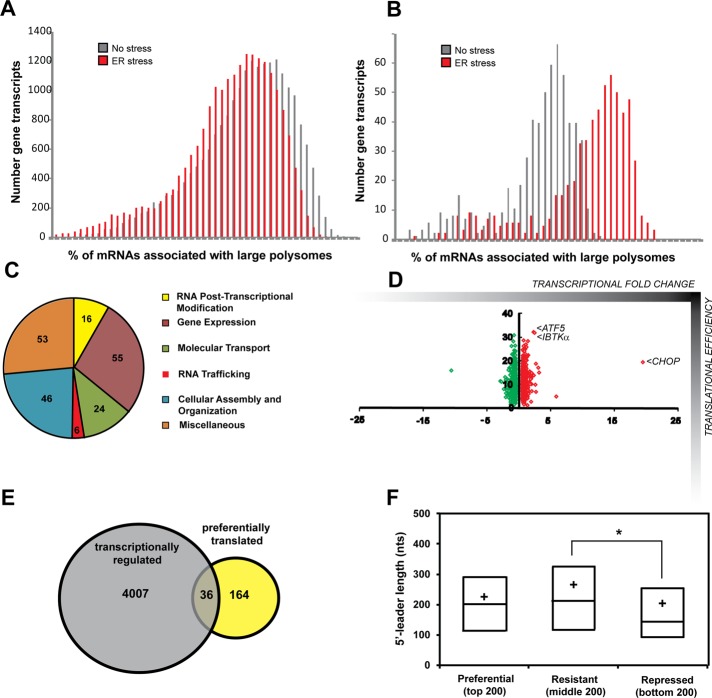
Genome-wide analyses of gene-specific translation during ER stress. (A) Number of gene transcripts as defined by analysis of the 22,862 probe sets associated with the indicated percentage of large polysomes in wild-type MEF cells treated with TG for 6 h or no stress. (B) Percentage association with large polysomes of the top 200 gene transcripts suggested to be preferentially translated in response to ER stress. (C) The categories of molecular and cellular functions as determined by ingenuity pathway analysis of the top 200 genes suggested to be subjected to preferential translation. (D) Scatterplot illustrating percentage shift toward large polysomes during stress suggestive of translational control (y-axis) vs. their relative mRNA fold changes in response to stress (x-axis, transcriptional control). (E) Venn diagram of the overlap between the 4007 genes encoding mRNAs that were significantly increased in response to ER stress (p < 0.05) and the top 200 genes suggested to be preferentially translated during ER stress. (F) Repressed genes encode mRNAs with significantly shorter 5′-UTRs than the stress-resistant cohort (one-way ANOVA with Tukey's HSD post hoc test, p = 0.0042). Lines of the box-plot diagram illustrate 75th, 50th, and 25th percentile values, and the + symbol indicates the arithmetic mean.

