
Figure 2. Plots of mean whole brain complexity of the individual participants with increasing age.
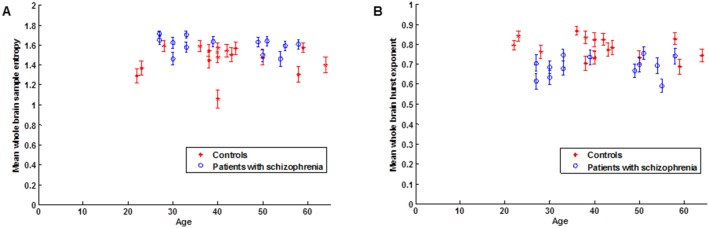
(A) Mean whole brain Sample entropy. (B) Mean whole brain Hurst exponent. Error bars denote the standard error of the mean.
Official websites use .gov
A
.gov website belongs to an official
government organization in the United States.
Secure .gov websites use HTTPS
A lock (
) or https:// means you've safely
connected to the .gov website. Share sensitive
information only on official, secure websites.
(A) Mean whole brain Sample entropy. (B) Mean whole brain Hurst exponent. Error bars denote the standard error of the mean.