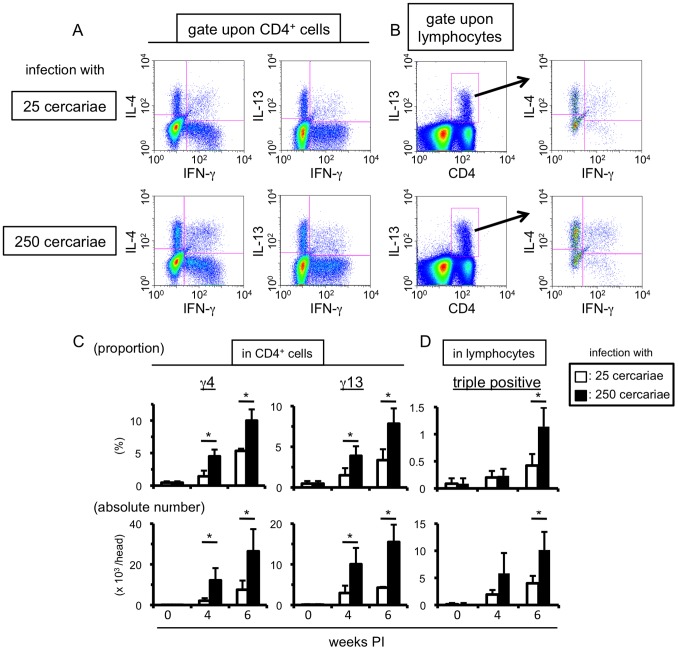
Figure 6. Infection with increased numbers of cercariae augments the induction of MCPHT cells.
(A–D) Hepatic lymphocytes were prepared from S. mansoni-infected mice at indicated time points, and the proportions and absolute numbers of γ4, γ13 (A and C), or triple positive (B and D) cells were investigated by ICS. (A and B) One example using hepatic lymphocytes prepared at 6 weeks PI was displayed. (C and D) Upper graphs; the proportions in CD4-positive (γ4 or γ13 cells, C) or in lymphocyte (triple positive cells, D) population are shown. Lower graphs; the absolute numbers of γ4, γ13 (C), or triple positive (D) cells are shown. Data are expressed as mean values+SD of three or four mice in each experimental time point. Data shown are a representative of three independent experiments. (C–D) Open bars represent the mice infected with 25 cercariae, and filled bars do those with 250 cercariae. *0.02<P<0.05 (Mann-Whitney U test).

