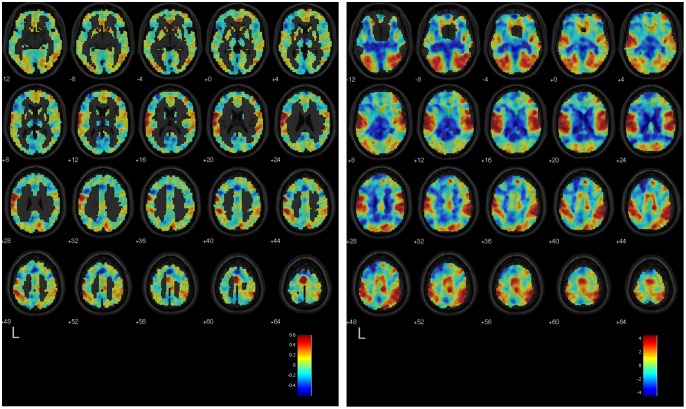
Figure 5. Left: Mean discriminating volume of the within-participant classifiers trained to separate scans from the Countdown and Positive Autobiographical Memory tasks.
Reddish tones indicate voxels where increased BOLD signal most consistently characterized the Countdown task, as opposed to the Positive Autobiographical Memory task, according to the training results of the linear SVM classifiers. Likewise, bluish tones indicate voxels where increased BOLD signal most consistently characterized the Positive Autobiographical Memory task, as opposed to the Countdown task. Right: Unthresholded statistical map (T-statistic values) of the contrast Countdown vs. Positive Autobiographical Memory obtained from the GLM group-level analysis. Reddish tones indicate areas of the brain where increased BOLD signal was observed during the Countdown task relative to the Positive Autobiographical Memory task, and bluish tones indicate areas where the reverse effect was observed. Both maps are overlaid on a template anatomical image. Shown are axial slices from MNI z = −12 to 64.

