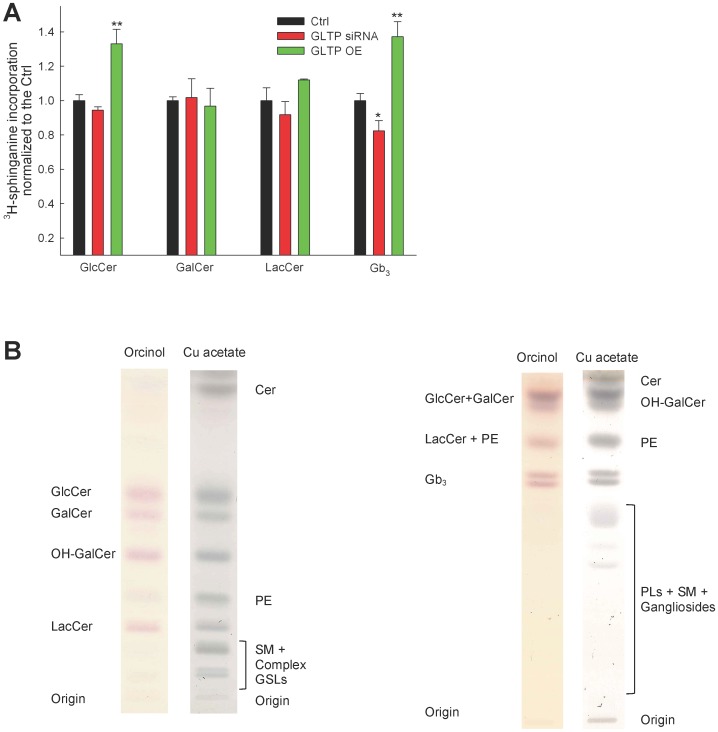
Figure 1. TLC analysis of metabolically labeled GSLs.
(A) Metabolic labeling of HeLa cells, normal (black), GLTP siRNA (red) and overexpression of GLTP (green). 3H-sphinganine incorporation into the sphingolipids was analyzed using TLC, and a mixture of both gene sequence #76 and #78 of the siRNA GLTP constructs were used. The TLC data for the incorporation of the radiolabeled 3H-sphinganine are from at least three different experiments, and the results are normalized to the controls. (B) Representative TLC plates illustrating a typical separation of the analyzed lipids. The plates were first stained with the carbohydrate specific orcinol, followed by 3% Cu acetate charring to visualize all lipids. Left plate, shows the effective separation of GlcCer, GalCer and LacCer using the solvent system 10∶2:4∶2:1 chloroform:methanol:acetone:acetic acid:H2O (v/v). Right plate, for effective Gb3 separation from other GSLs we used the 45∶55:10 chloroform:methanol:0.2% CaCl2 (in H2O) (v/v) solvent system. The statistical significance compared to the respective controls is indicated with asterisks. One asterisk (*) p<0.05 and two asterisks (**) p<0.01 indicate the statistical significance compared to the controls.

