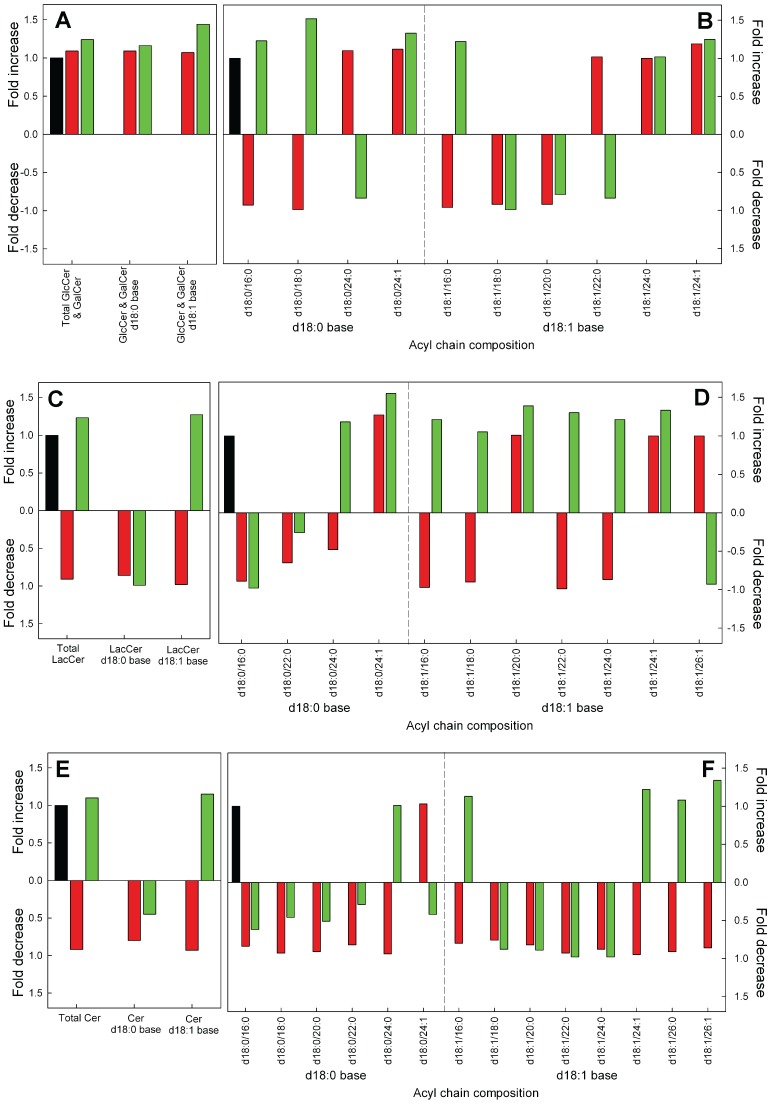
Figure 3. Relative change in GlcCer/Galcer, LacCer and Cer after knockdown or overexpression of GLTP in HeLa cells normalized to control cells.
(A) Changes in the total masses of GlcCer/GalCer and GlcCer/GalCer with d18∶0 and d18∶1 base respectively. (B) Changes in the GlcCer/GalCer species after siRNA or OE treatments, compared to the control. (C) Changes in the total masses of LacCer and LacCer with d18∶0 and d18∶1 base respectively and (D) changes in the LacCer species. (E) Changes in the total masses of Cer and Cer with d18∶0 and D18∶1 base respectively, with (F) showing the changes in the Cer species. The data for siRNA GLTP (red bars) and GLTP OE (green bars) were normalized to the levels in the mock control cells (black bars). The abbreviations for the lipid classes are given in “Materials and Methods”. For clarity, minor species are not presented in the graph. For full list of species and quantitative data with SD, see Table S1).

