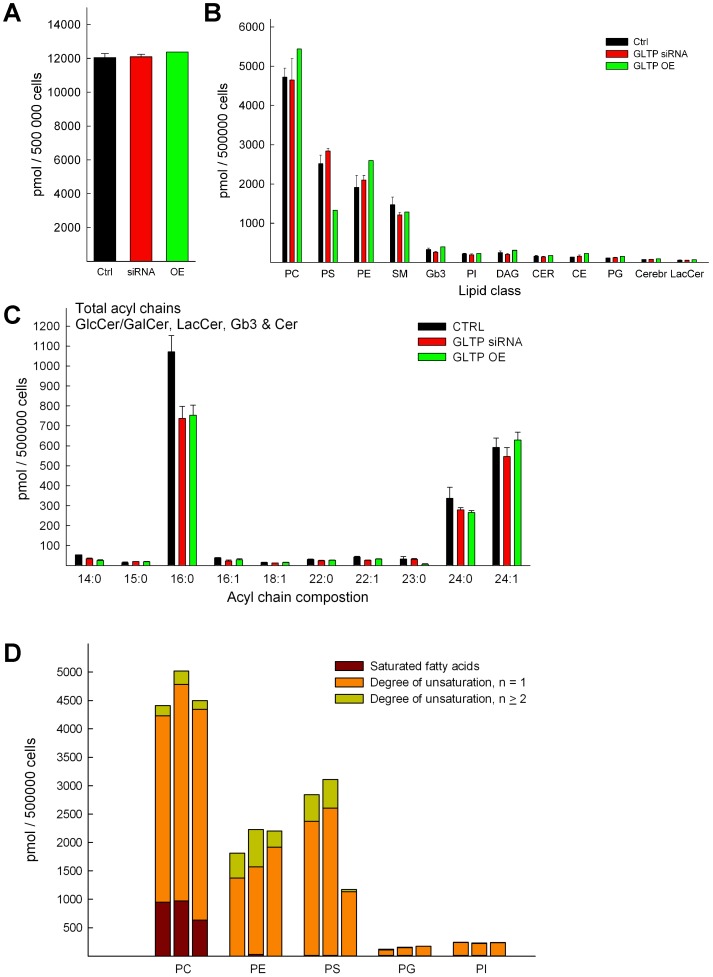
Figure 7. Summarized lipid amounts.
(A) Comparison of the total lipid content summarized (from the MS data) between CTRL (black bars), GLTP siRNA cells (red bars) and GLTP overexpressing cells (green bars). Lipid quantities were calculated on the basis of the corresponding IS and the amounts (pmol/500000 cells) represented the sum of all individual molecular species of all lipid classes. (B) Comparison of the abundance of the lipid classes analyzed in this study. (C) Changes in the distribution of the amide-linked hydrocarbon chains in sphingolipids (GlcCer/GalCer, LacCer, Gb3, Cer and SM) of normal, GLTP siRNA and GLTP overexpressing HeLa cells. (D) Changes in the degree of unsaturation of the acyl chains in the different phospholipid classes relative to GLTP expression. Left control, middle GLTP siRNA and right GLTP OE HeLa cell samples, n is the sum of degree of unsaturation of fatty acid chains in the phospholipids.

