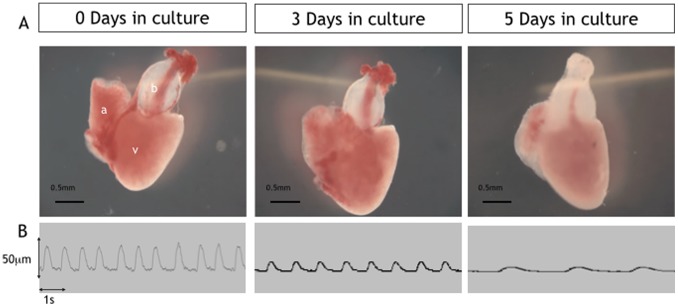
Figure 1. Low power images of excised cultured hearts (days 0–5).
Upper panel (A) showing examples of excised hearts maintained in culture for 0, 3 and 5 days. Lower panel (B) shows example traces from Video-edge detection method displaying movement of the ventricle wall which was used to assess heart rate and ventricle function at days 0,3 and 5 in culture.

