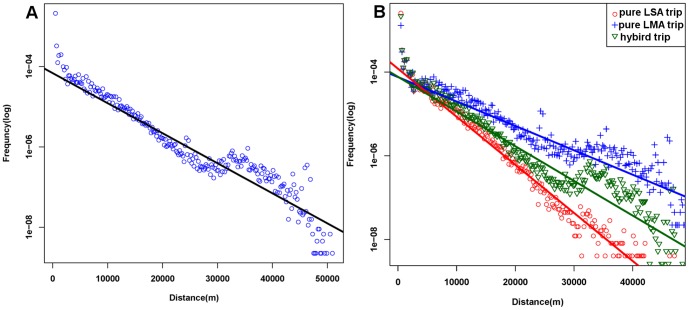
Figure 7. Distribution of trip distances.
A) The distance distribution of all trips. B) The distance distribution of three trip patterns. The exponent of pure LMA trips is 0.134 km−1 (R2 = 0.713) whereas the pure LSA's is 0.264 km−1 (R2 = 0.9312). The exponent for hybrid pattern is 0.191 km−1 (R2 = 0.814).

