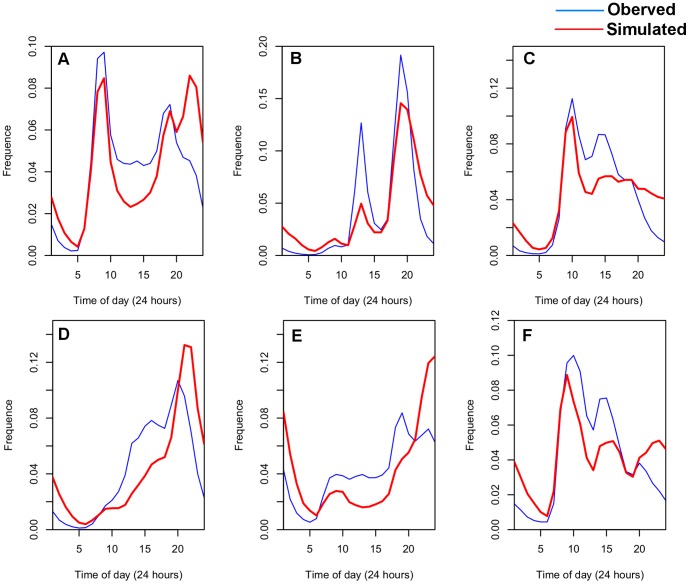
Figure 11. Comparison between temporal distributions of observed and simulated categories.
a) Transportation, the Hellinger coefficient is 0.976. b) Dining, the Hellinger coefficient is 0.950. c) Work, the Hellinger coefficient is 0.969. d) Entertainment, the Hellinger coefficient is 0.956. e) Home, the Hellinger coefficient is 0.960. f) Other, the Hellinger coefficient is 0.973. Although deviations still exist in the simulated ones, the deviation values are only a few percent. Besides, all simulated results have similar peak shapes to the observed ones.

