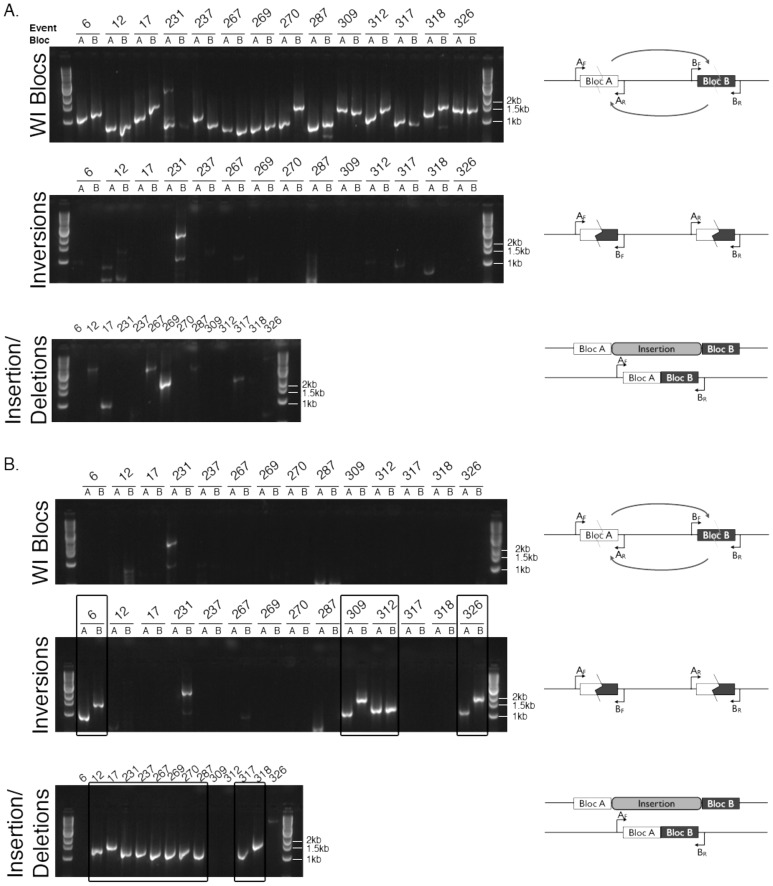
Figure 4. PCR validation of rearrangements identified in silico.
PCR reactions used DNA from the A. WI strain and B. UCB strain. The top gel image in each figure used primers in the orientation to amplify across blocs in the WI strain. Middle images had primers to amplify across blocs in the UCB strain for a relative inversion. Bottom images show reactions priming across insertions in the WI strain relative to the UCB strain. Diagrams to the right of each gel image depict the primer configurations for PCR amplification across blocs. Small arrows indicate relative position and direction of forward (F) and reverse (R) primers for a set of paired mate blocs in the WI strain. Zigzag lines indicate breakpoints. Curved arrows indicate the direction of inversion. All PCR products for each strain were run on a single gel. Each PCR reaction is labeled by event and bloc (A or B), and boxes highlight successful amplification of rearrangement events in the UCB strain.

