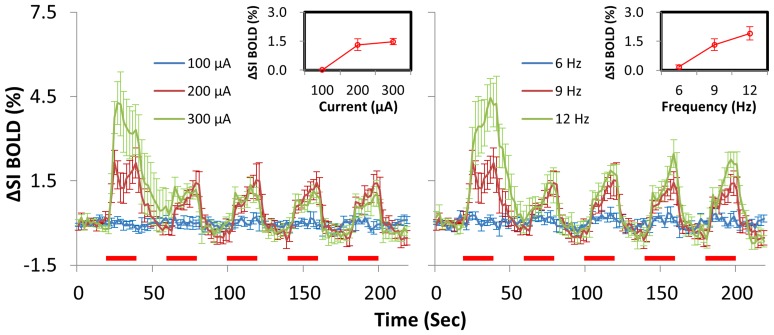
Figure 4. Amplitude and frequency dependency of BOLD response in dexmedetomidine-anesthetized rats.
Averaged time courses within the S1 of 6 animals are plotted for 3 stimulus currents in the left panel, and 3 frequencies in the right panel. Red bars under the time courses indicate the 20-s stimulation period. The insets show the response amplitude versus the stimulus current or frequency.

