
Figure 3. Expression of CD44 is significantly increased in the HT29 LM1, LM2, and LM3 cell lines.
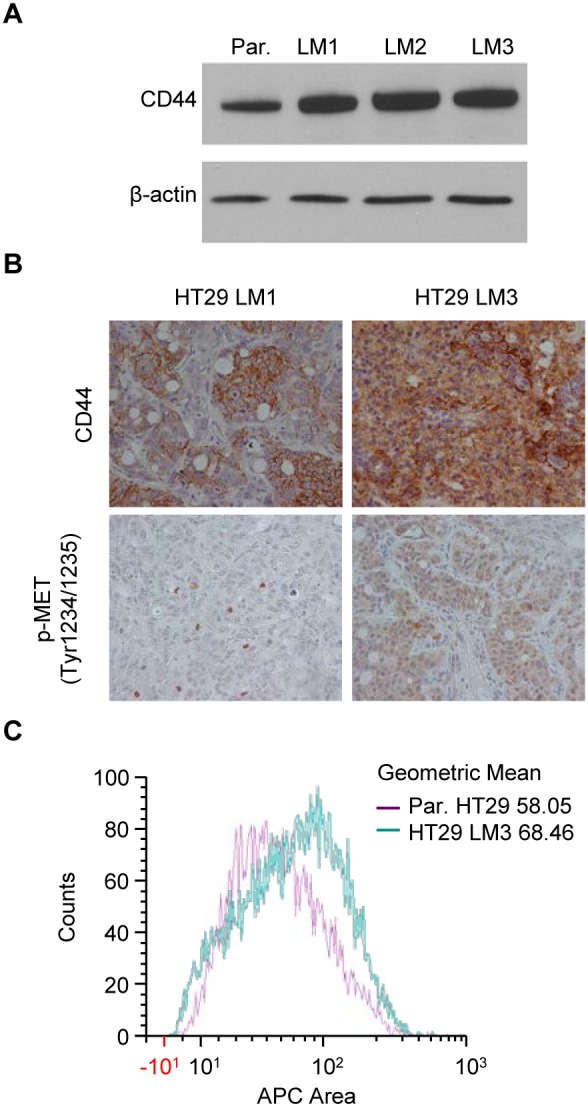
(A) HT29 LM1, LM2, LM3 and parental cell line were cultured in normal medium for 24 h. Protein expression profiles were analyzed by Western blot. β-actin was used as a loading control. (B) IHC analysis of CD44 and p-MET expression in HT29 LM1 and HT29 LM3 liver metastasis tissue sections. (C) Flow cytometry analysis of CD44 geometric mean fluorescence intensity in parental HT29 and HT29 LM3 cells.