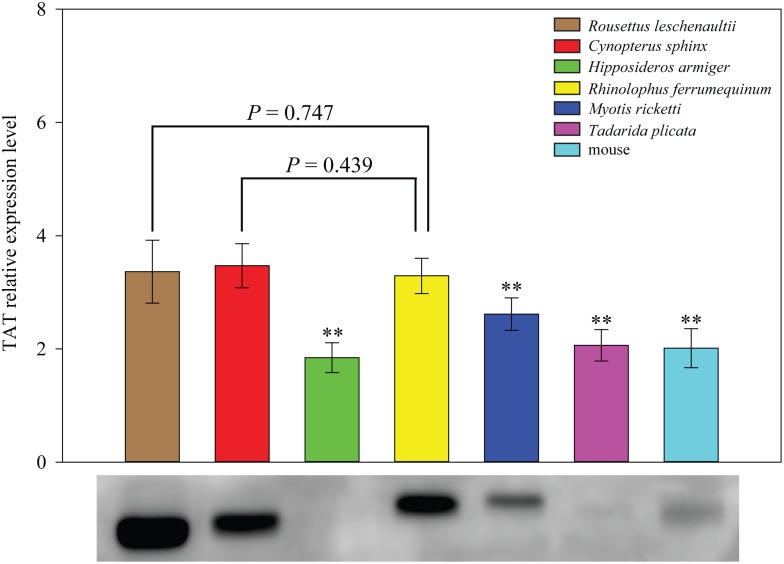
Figure 4. Expression pattern of tyrosine aminotransferase protein.
Protein expressions of tyrosine aminotransferase in the livers of six representative bat species and mice were determined by Western blotting. For each species, three individuals were used for replication. Relative protein levels are presented as mean ± SD. The lowest level of a detectable protein is considered as 1. Western blotting against the tyrosine aminotransferase antibody on the PVDF membrane is shown beneath the histogram. Statistic significance (**P<0.001) is determined by one-way ANOVA, followed by Fisher’s least significant difference (LSD) post hoc tests.

