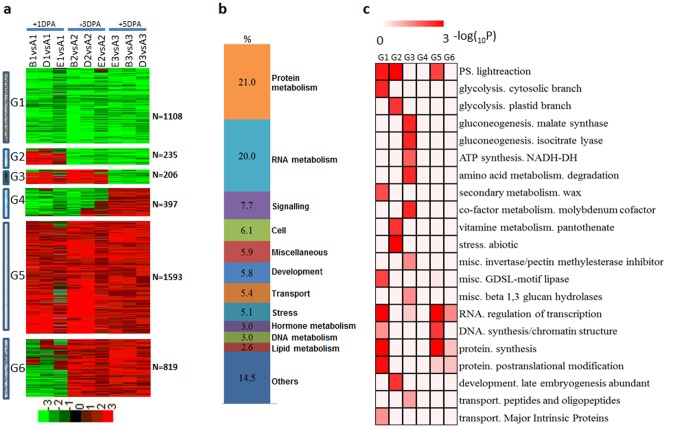
Figure 2. Dynamic progression of common differentially expressed genes in the dominant mutants.
(a) Unsupervised hierarchical clustering of the 4,358 common DEGs in the dominant mutants. Common DEGs were clustered into six groups and the number of genes of each group was listed at right. Red region, genes upregulated in the mutants; green region, genes downregulated in the mutants. A, TM-1; B, SL1-7-1FLM; D, MD17FLM; E, N1NSM; 1, +1 DPA; 2, +3 DPA; 3, +5 DPA. (b) Functional distribution of common DEGs in the dominant mutants. (c) Functional category enrichment of common differentially expressed genes in the dominant mutants.

