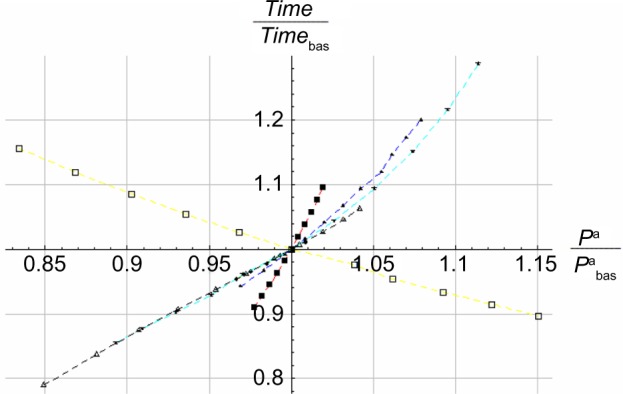
Figure 10.

The relative time to complete the race as a function of the relative locomotive power.
Notes: ■ Red, mass; ▲ blue, friction; ♦ green, density; ★ cyan, wind speed; □ yellow, maximum locomotive power; △ black, drag.

The relative time to complete the race as a function of the relative locomotive power.
Notes: ■ Red, mass; ▲ blue, friction; ♦ green, density; ★ cyan, wind speed; □ yellow, maximum locomotive power; △ black, drag.