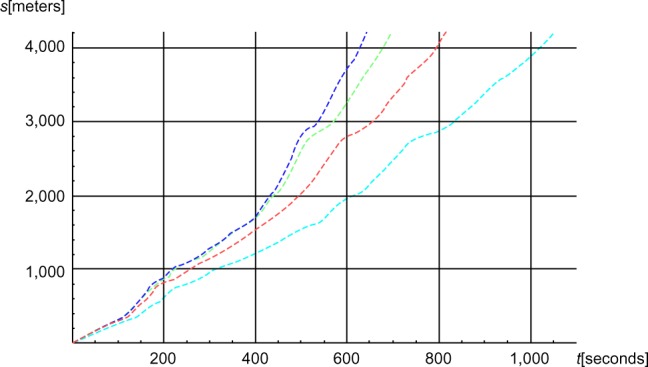
Figure 14.

The accumulated simulated distance (s) in meters as functions of time (t) in seconds.
Notes: Red, baseline; blue, CdA =0; green, −5 m/second tailwind; cyan, +5 m/second headwind (where Cd is the drag coefficient, and A is the projected front area of the skier).
