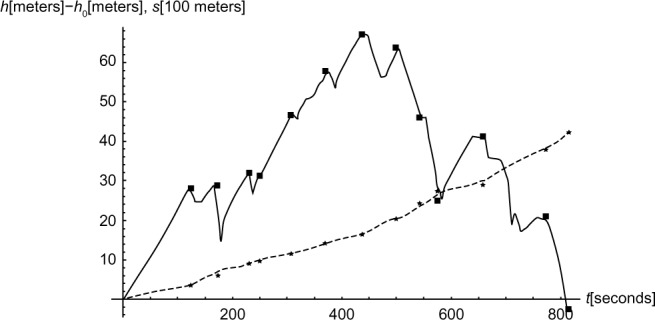
Figure 4.

The experimental height (h−h0) and accumulated distance (s), and simulated height (h−h0) and accumulated simulated distance (s) as functions of time (t) in seconds.
Notes: h0 =183 m is initial height. ■ denotes 13 points where time measurements were made for height. The height is relative to initial height in meters; ★denotes 13 points where time measurements were made for accumulated distance. The distance is in units of 100 m; — denotes simulated height (h−h0); ------ denotes accumulated simulated distance (s).
