
Figure 10.
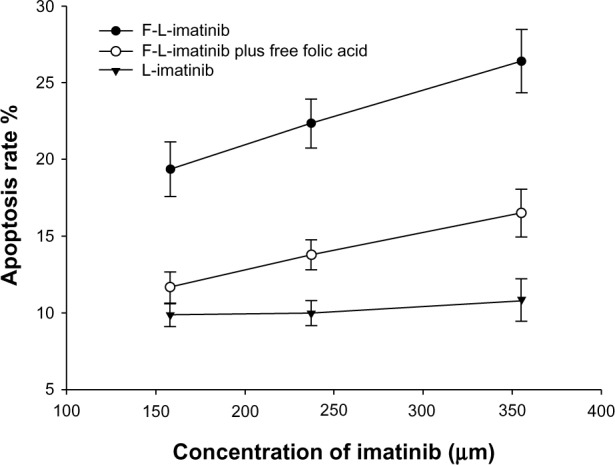
Dose–response curves obtained for HeLa cells treated with different imatinib formulations.
Notes: The rate of apoptotic cells was determined by FCM. Each value represents the mean ± SD (n=3).
Abbreviations: FCM, flow cytometry; F-L-imatinib, folate receptor-targeted liposomal imatinib; L-imatinib, non-targeted liposomal imatinib; SD, standard deviation.