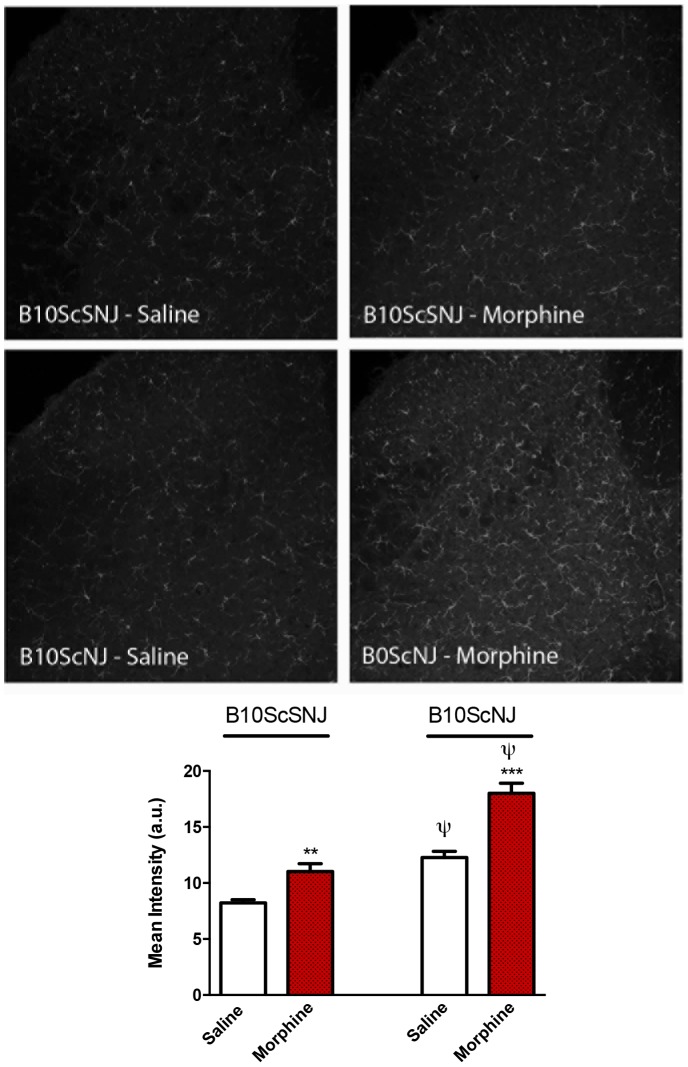
Figure 8. Morphine induces microglial activation in control and TLR4 null mice.
Control (B10ScSNJ) and TLR4 null (B10ScNJ) mice were treated with escalating doses of morphine over 5 days. Mice were underwent cardiac perfusions with 4% PFA 2 h following naloxone precipitated withdrawal and processed for immunohistochemistry of Iba-1 labeling. Significant differences in labeling intensity were produced by morphine in both groups of mice. Additionally, a genotype effect was identified where more microglial activation was identified in the TLR4 null mouse compared to control strain. Data represent means for n = 5 per group. The asterisk denotes a significant difference from saline-treated control response. **p<0.01, ***p<0.001. The ψ denotes a significant difference between genotypes receiving saline treatment.

