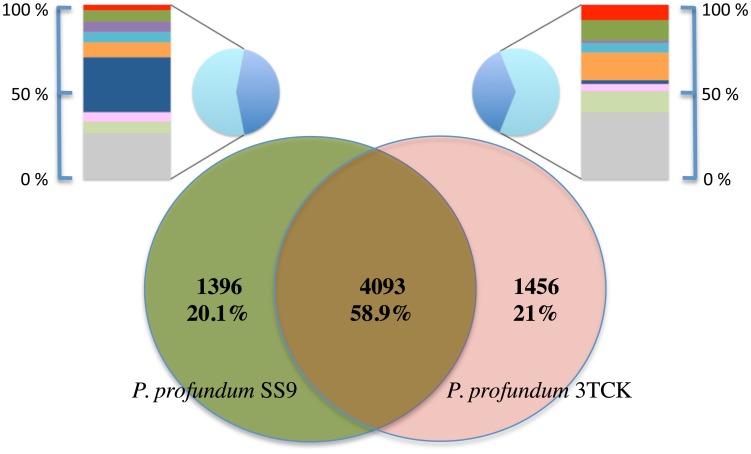
Figure 3. Gene content comparison in P. profundum strains.
Shared gene comparison between the two bathytypes SS9 and 3TCK. The larger Venn diagram shows the number of orthologous genes shared and the number of genes unique to each bathytype. The smaller pie charts are the proportion of unique genes to each bathytype with (light blue) or without (dark blue) matches to the COG database. The matching genes were assigned to COG categories (from top to bottom): E-Amino acid transport and metabolism (red); G-Carbohydrate transport and metabolism (green); N-Motility and chemotaxis (violet); S-Function unknown (cyan); R-General function prediction only (orange); L-DNA Replication, Recombination and Repair (blue); T-Signal Transduction (pink); K-Transcription (light green); Other categories (grey).

