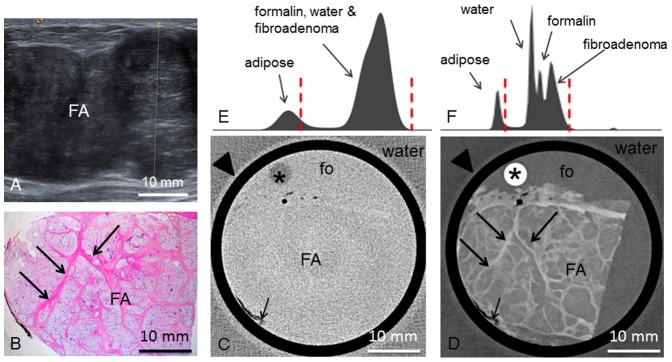
Figure 6. Preoperative imaging, histology, absorption- and phase-contrast CT of case 6.

Preoperative ultrasonography (A) of the fibroadenoma (FA). Representative histological slice (B) of the FA. Corresponding absorption- (C) and phase-contrast CT (D) slice. Long arrows indicate strands of fibrous tissue. Short arrows indicate adhering adipose tissue. (E) and (F) show the histograms of the whole 3D volume dataset of the absorption- and phase-contrast CT, respectively. In (E), only two distinct peaks for adipose tissue and formalin (fo), water and FA are seen. whereas in (F), the histogram reveals four distinct peaks for adipose tissue, water, formalin and fibroadenoma. Window levels are marked with dashed red lines. Arrowheads in (C) and (D) indicate plastic container surrounding the sample.
