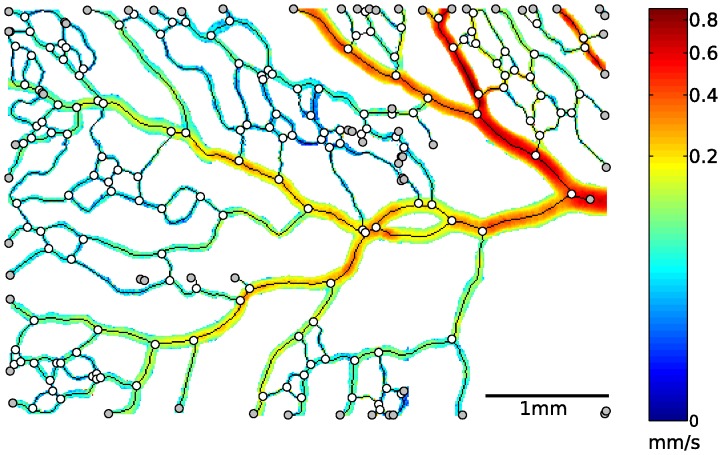
Figure 5. Time-averaged velocity magnitudes of a measurement region are shown, together with with the corresponding skeleton (black line), branch points (white circles), and end points (gray circles).
The flow enters the measurement region from the right. Note that a non-linear color scale was used for the velocity magnitude.

