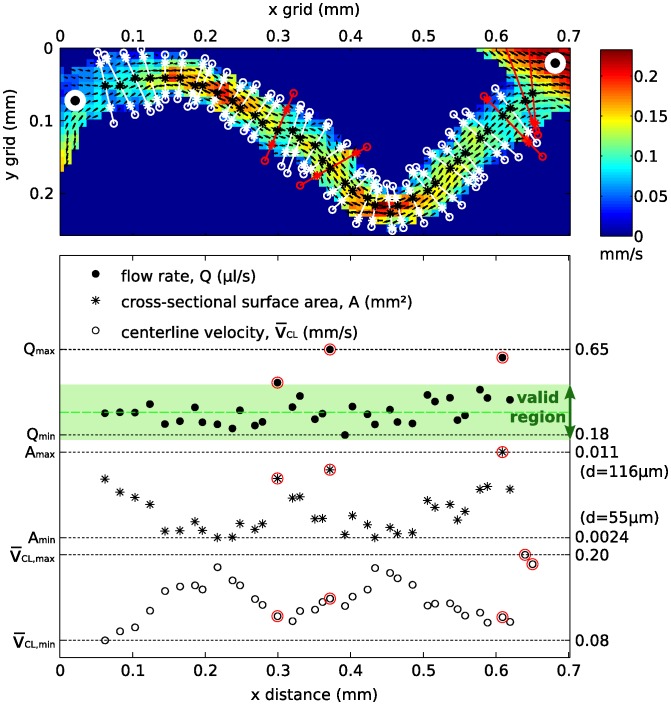
Figure 6. Multiple parabolic fits at several locations on the vessel centerline were performed to obtain a single characteristic velocity and diameter for each vessel segment.
The time-averaged flow rate is assumed constant throughout the vessel segment. The valid region is bounded by 0.5 and 1.5×the median flow rate, and the red-encircled data points were not incorporated, due to a strongly deviating flow rate. Note that the fitted diameters and flow rates for the two data points on the far right are too large to be visible in the graph.

