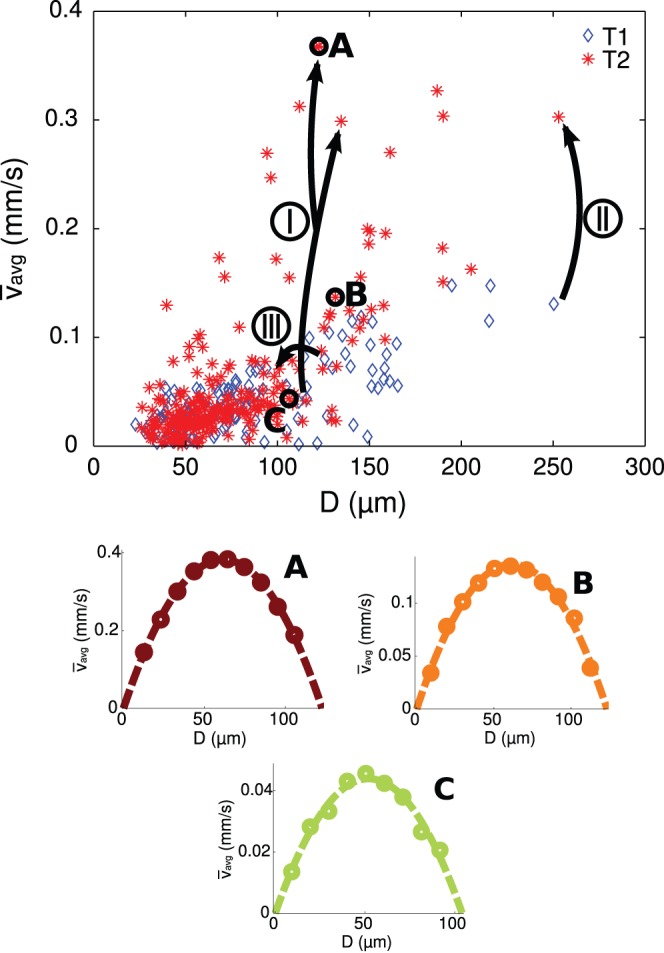
Figure 9. The variety in time-averaged mean velocities for all vessel segment diameters are shown for two consecutive measurements T1 and T2.

For three vessel segments (I, II, and III, indicated in Figure 8), the changes in diameter and time-averaged velocity from T1 tot T2 are indicated by the dashed arrows. The cross-sectional velocity profiles shown for three data points (A, B, and C, indicated in Figure 8) show consistency despite the different time-averaged velocities.
