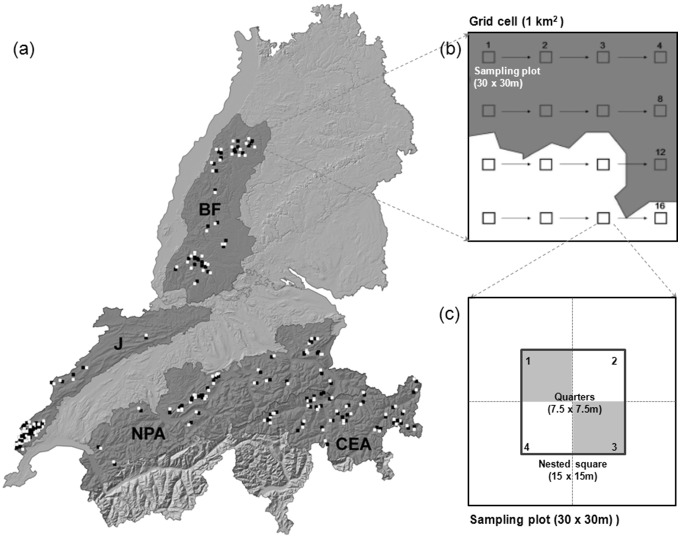
Figure 1. Study area (a) with the four mountain ranges [Black Forest (BF), Swiss Jura (J), Northern Prealps (NPA) and Central Eastern Alps (CEA)] and the spatial distribution of 1 km2 grid cells with species’ presence (white) and absence (black).
Within each grid cell, environmental variables were recorded at or in the surrounding of maximum 16 regularly distributed sampling plots (b), with only plots located in the forest (dark grey) considered in the analysis. At each plot, vegetation variables were recorded in the field at different reference areas (c), either across the whole plot (30×30 m), within a nested square (15×15 m), or within the two diagonal quarters of which (7.5×7.5 m). The variables and the reference area at which they were recorded are specified in Table 2. Geodata: Switzerland: © Bundesamt für Landestopografie Swisstopo (Art. 30 GeoIV): License No.: 5704 000 000, Available at: http://www.swisstopo.admin.ch/internet/swisstopo/en/home/products/height/dhm25.html; Germany: © Landesamt für Geoinformation und Landentwicklung Baden-Württemberg (LGL), License No.: 2851.9-1/19, Avaliable at: http://www.lgl-bw.de/lgl-internet/opencms/de/07_Produkte_und_Dienstleistungen/Geodaten/Digitale_Gelaendemodelle.

