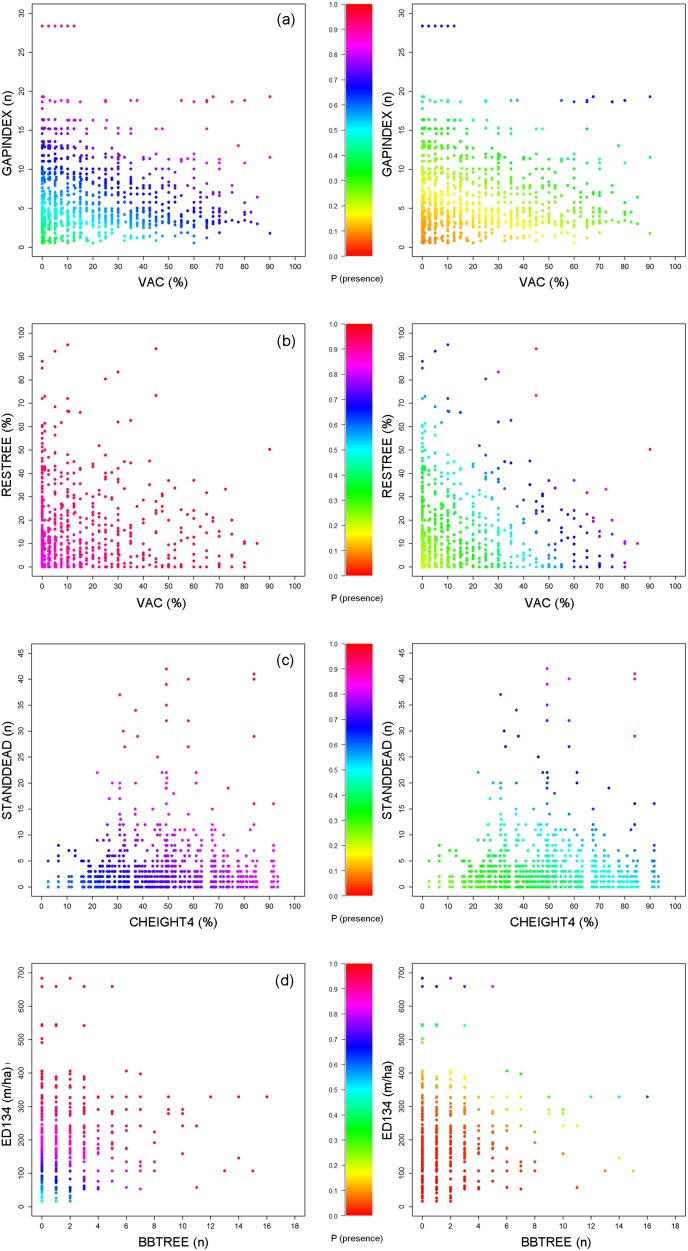
Figure 4. Compensating for climate change effects by modifying in concert the two most upper-ranked vegetation variables per species: predicted probability of species presence (colour scale) for (a) capercaillie, (b) hazel grouse, (c) three-toed woodpecker and (d) pygmy owl under current (2010, left) and future (2050, right) climate conditions, modeled in dependence of the two vegetation variables with the highest compensation potential, while holding all other variables constant at their empirical average.
For variable codes see Table 2.

