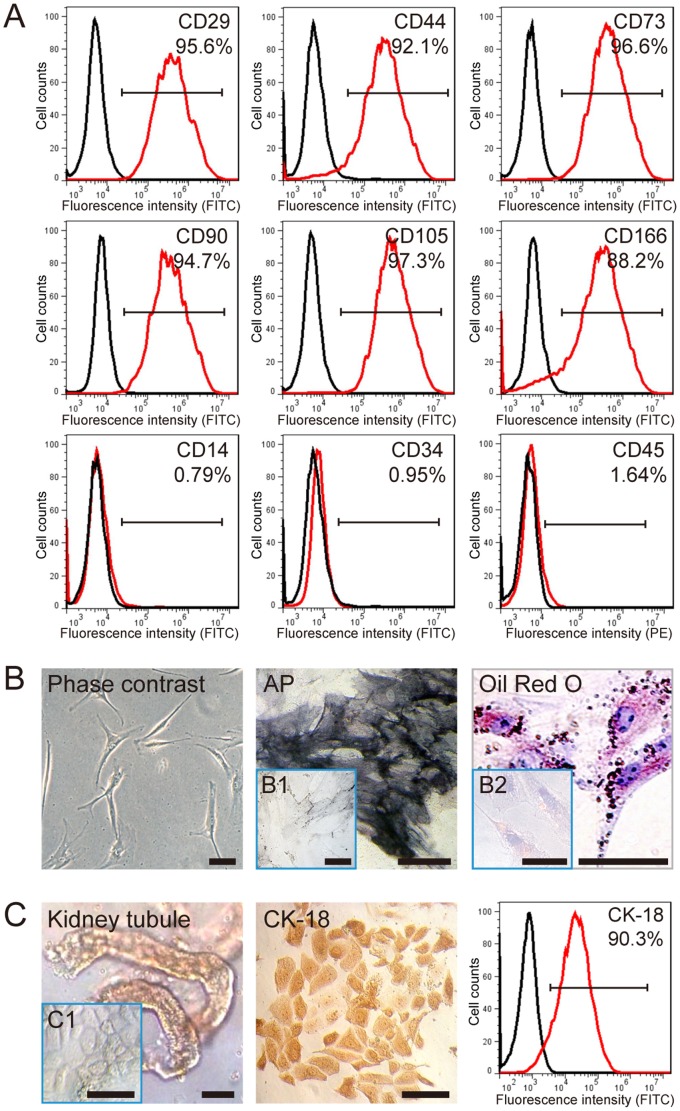
Figure 1. Characterization of BMSCs and RTECs.
A: Immunophenotype of isolated BMSCs. Isolated rat BMSCs were characterized by FACS. BMSCs were positive for CD29, CD44, CD73, CD90, CD105, and CD166, and nearly negative for CD14, CD34, and CD45. B: Differentiation characteristics of BMSCs. The phase contrast of BMSCs is shown on the left. Osteogenic differentiation was detected by AP staining (middle), and adipogenic differentiation was visualized by Oil Red O staining of the lipid vesicles (right). BMSCs cultured with normal medium were used as the negative control group for each stain (B1 and B2). C: Immunophenotype of isolated RTECs. The appearance of kidney tubules is shown on the left and the confluent RTECs in culture were shown in C1. The isolated rat RTECs were characterized by immunohistochemistry (middle) and FACS (right), and they were positive for CK-18. All scale bars correspond to 200 µm.

