
Figure 3. Level of kidney weight coefficients in each group.
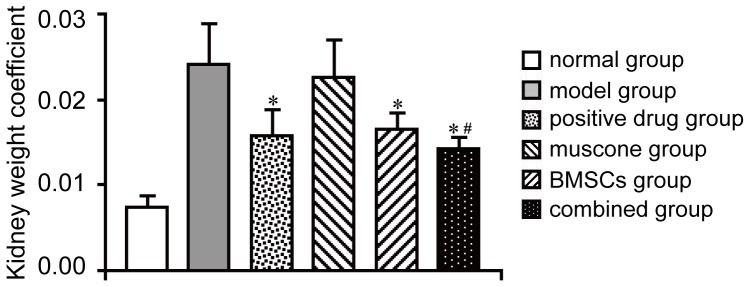
*P<0.05 compared with the model group; #P<0.05 compared with the muscone and BMSC groups.
Official websites use .gov
A
.gov website belongs to an official
government organization in the United States.
Secure .gov websites use HTTPS
A lock (
) or https:// means you've safely
connected to the .gov website. Share sensitive
information only on official, secure websites.
*P<0.05 compared with the model group; #P<0.05 compared with the muscone and BMSC groups.