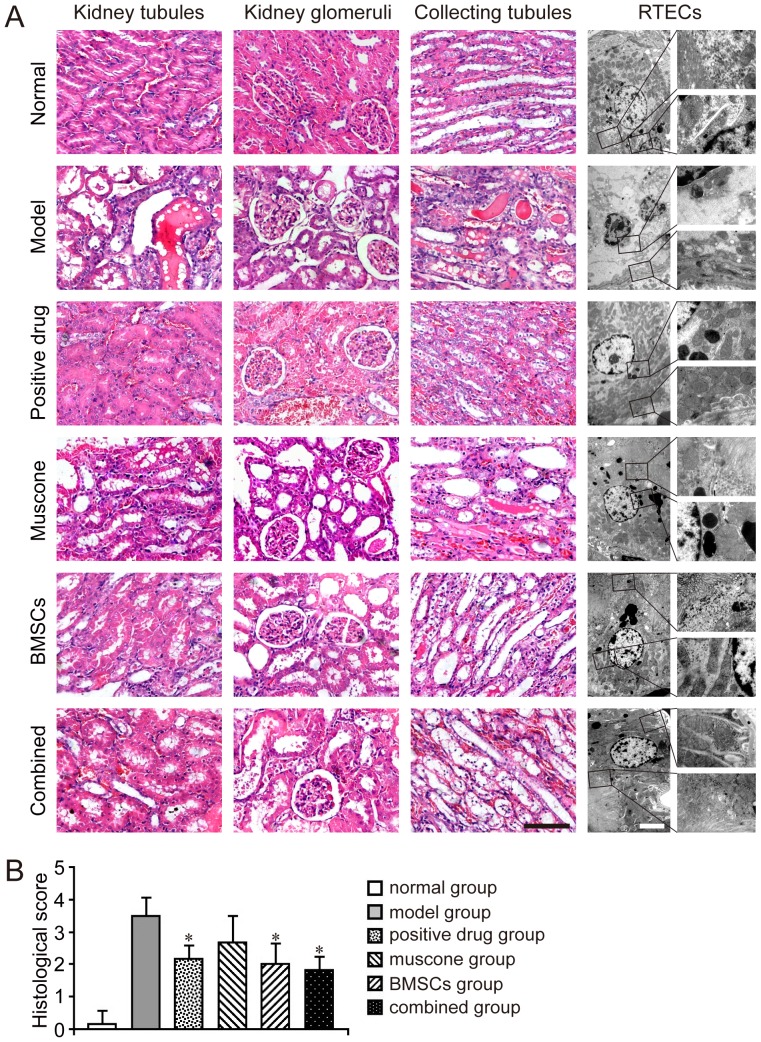
Figure 4. Detection of pathological changes in each group.
A: Pathological changes of each group. Pathological changes in the kidney tubules, kidney glomeruli, and collecting tubules were observed under a light microscope using H&E staining. Dilatation and necrosis in the kidney tubules and collecting tubules of the model group were observed in various degrees. In the combined and BMSC groups, nearly no effusion was observed in the kidney tubules or collecting tubules, and both tubules remained slightly expanded compared with the normal group. Ultrastructures of RTECs were further observed under TEM. The RTECs in the normal group had minimal heterochromatin and numerous organelles in the cytoplasm. In the AKI model, the RTECs showed an apoptotic appearance with deformed nuclei, more heterochromatin, and fewer organelles. Positive drug or muscone treatment resulted in numerous mitochondria and few cytolysosomes in the RTEC cytoplasm. The RTECs of both the BMSC and combined groups were restored well, and showed no significant difference. Scale bar of the phase observed through H&E staining corresponds to 100 µm, and scale bar of the phase observed under TEM corresponds to 4 µm. B: Histological score of each group. Results are expressed as mean ± SEM. A t-test was used to compare the various groups. *P<0.05 compared with the model group.

