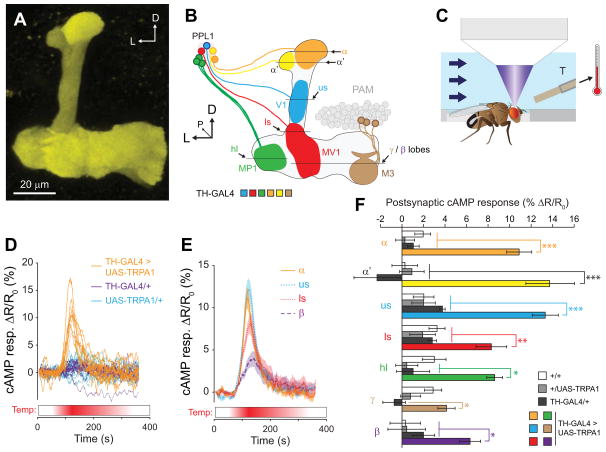
Figure 2. Stimulation of TH-GAL4+ dopaminergic neurons elevated cAMP across broad spatial regions of the MB.
(A) Maximum intensity projection of a z stack of YFP fluorescence from a MB-TepacVV fly. D: doral, L: lateral.
(B) Schematic of the MB and PPL1 dopaminergic neurons, showing the z planes that were selected for imaging. Different dopaminergic neurons in the PPL1 cluster, all of which are labeled by the TH-GAL4 driver, are shown in different colors. D: dorsal, L: lateral, P: posterior, us: upper stalk, ls: lower stalk.
(C) Schematic of the in vivo imaging chamber, showing the fly’s position relative to the thermistor, the microscope objective (not to scale), and the saline flow.
(D) Time series traces of TepacVV responses to stimulation of dopaminergic neurons in TH-GAL4>UAS-TRPA1, MB- TepacVV flies (heterozygous for all transgenes), as well as controls lacking the GAL4 or UAS elements. The lines represent the responses imaged in the upper stalk of individual flies (n = 12).
(E) Time series TepacVV responses to thermogenetic stimulation (as in panel D), imaged from different regions of the MB. Lines and shaded regions represent the mean and S.E.M, respectively.
(F) Bar graphs of MB-TepacVV peak response magnitudes across different spatial regions of the MB (mean ± S.E.M.) following thermogenetic stimulation of TH-GAL4+ dopaminergic neurons (n ≥ 10). *p<0.05, **p<0.01, ***p<0.001 (Tukey).

