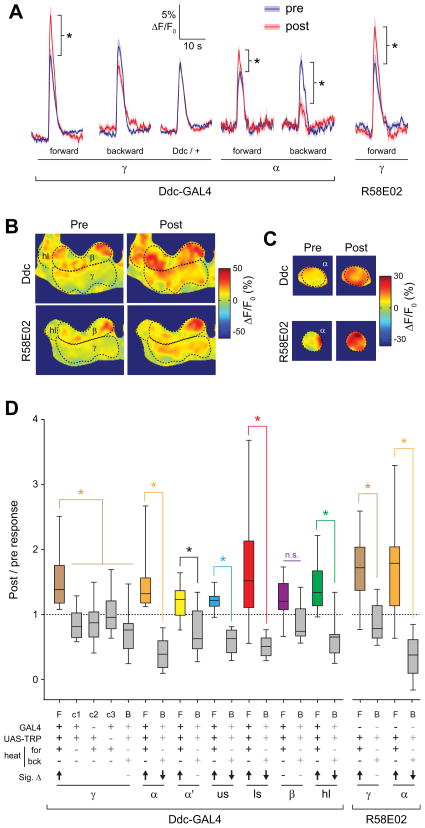
Figure 5. Conditioning with PAM dopaminergic neurons stimulation yielded broad, bidirectional Ca2+ response plasticity across the MB.
(A) Comparison of pre- and post- conditioning odor responses for several genotypes, conditioning paradigms, PAM-specific GAL4 lines (Ddc and R58E02), and MB regions (n ≥ 10). *p < 0.05 (Mann-Whitney).
(B) Pseudocolor images of the odor responses in the β and γ lobes before and after conditioning from a representative fly using the Ddc- and R58E02-GAL4 drivers. Scale bar = 10 μm.
(C) Pseudocolor images of the odor responses in the α tip before and after conditioning from a representative fly. Scale bar = 10 μm.
(D) The post / pre odor response ratio for all genotypes, conditioning paradigms, and MB regions (n ≥ 10). There was a significant effect across groups (p < 0.001; Kruskal-Wallis). *p<0.05 (Mann-Whitney); n.s.: not significant. In the legend below the figure, Sig. Δ indicates significant change in odor-evoked ΔF/F following conditioning within each group, with direction indicated by arrow (Wilcoxon signed-rank; p < 0.05). F: forward, B: backward, c1: control 1 (no heat), c2: control 2 (no GAL4), c3: control 3 (no TRPA1), us: upper stalk, ls: lower stalk, hl: heel.

