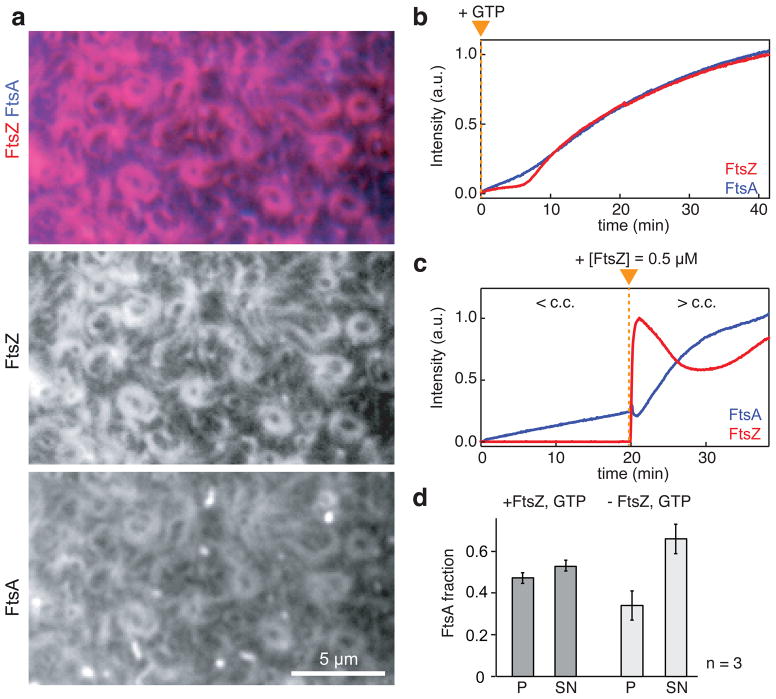
Figure 4. FtsZ and FtsA co-assemble on the membrane.
(a) Typical micrograph of reorganizing filament patterns with fluorescently labeled FtsZ and FtsA (FtsZ, 1.1 μM with 30% FtsZ-Alexa488; FtsA, 0.4 μM with 10 % Cy5-GG-FtsA). (b and c) Representative intensity traces corresponding to the amount of FtsZ (red) and FtsA (blue). (b) After adding GTP (orange arrowhead), FtsZ and FtsA assemble simultaneously on the membrane. Similar micrographs and intensity curves were obtained in more than 50 experiments. (c) Binding of FtsA is slow at a low concentration of FtsZ (< c.c. = critical concentration of FtsZ allowing for filament network formation), but facilitated at higher FtsZ concentration (> c.c.). Orange triangle indicates time of FtsZ addition. Similar intensity traces were obtained in five independent experiments. (d) Bar plot representing the amount of FtsA co-pelleting with vesicles (P) or remaining in the supernatant (SN) after 30 min of incubation (see also Supplementary Fig. 7b). The presence of FtsZ filaments (+FtsZ, GTP), increases the amount of FtsA bound to the membrane (p=0.0391). Error bars represent s.d. from n=3 independent experiments. Source data is given in Supplementary Table 1.

