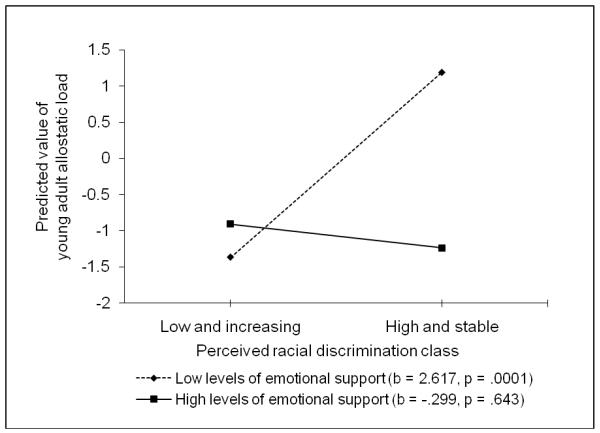
Figure 2.
The effect of perceived racial discrimination on young adults’ allostatic load by level of emotional support. The lines represent the regression lines for different levels of emotional support (low: 1 SD below the mean; high: 1 SD above the mean). Numbers in parentheses refer to simple slopes.

