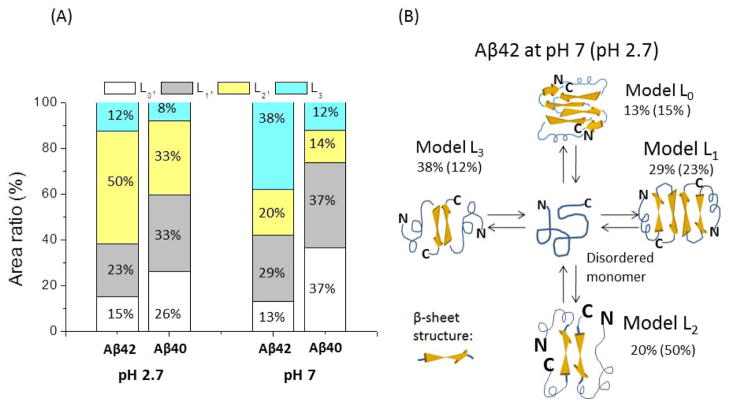
Figure 5.
Schematics for dimer structures. (A) Models for Aβ42 dimers. The monomer in intrinsically disordered conformation is shown in the middle. Four different folding models corresponding to specific contour lengths are shown. The populations of each conformer calculated from histograms in Fig. 4 are indicated. The data for pH 2.7 are shown in parentheses. (B) The stacked histograms for the populations of each conformer for Aβ42 dimers are shown on the left. The right histogram is taken from ref. 10.

